Ruda Momentum Trend Trading Strategy
Author: ChaoZhang, Date: 2024-04-03 15:16:47Tags: EMAOBV
Overview
The Ruda Momentum Trend Trading Strategy is a quantitative trading strategy based on momentum and trend indicators. The strategy uses indicators such as OBV (On Balance Volume), EMA (Exponential Moving Average), and candlestick body ratio to determine buy and sell signals. When the short-term EMA crosses above the long-term EMA, OBV reaches a new high, and the candlestick body ratio is greater than the set threshold, the strategy buys at the next day’s opening price; when the price falls below the stop-loss price or the closing price falls below the short-term EMA, the strategy closes the position.
Strategy Principle
- Calculate two EMA lines with parameters of 5 for the short-term EMA and 21 for the long-term EMA. When the short-term EMA crosses above the long-term EMA, the trend is considered upward, and vice versa.
- Calculate the OBV indicator. When OBV reaches a 10-day high, the bullish momentum is considered strong.
- Calculate the candlestick body ratio. When the body ratio is greater than the set threshold (default 50%), the trend is considered established.
- When the trend is upward, bullish momentum is strong, and the trend is established, the strategy buys at the next day’s opening price with a stop-loss price set at the minimum of the current day’s low and the opening price minus 1%.
- When the price falls below the stop-loss price or the closing price falls below the short-term EMA, the strategy closes the position.
Advantage Analysis
- By combining trend and momentum indicators, the strategy can capture strong instruments.
- Using the next day’s opening price for buying and dynamic stop-loss can avoid some false breakouts.
- The stop-loss and take-profit conditions are clear, and the risk is controllable.
Risk Analysis
- Trend and momentum indicators have a lag, which may lead to buying at high prices and premature stop-losses.
- Fixed parameters lack adaptability, and performance may vary significantly under different market conditions.
- Backtesting on a single market and instrument requires further verification of the strategy’s stability and applicability.
Optimization Direction
- Optimize the parameters of trend and momentum indicators to improve indicator sensitivity and effectiveness.
- Introduce market state judgment and dynamically adjust parameters according to current market characteristics.
- Expand the backtesting scope, increase testing on different markets and instruments to improve strategy robustness.
- Consider introducing position management and risk control modules to improve the risk-reward ratio.
Summary
The Ruda Momentum Trend Trading Strategy is a simple and easy-to-use quantitative trading strategy that captures strong instruments and trend opportunities by combining trend and momentum indicators. However, the strategy also has certain limitations, such as indicator lag and fixed parameters. In the future, the strategy can be optimized and improved by optimizing indicator parameters, introducing adaptive mechanisms, expanding the backtesting scope, and strengthening risk management to enhance the strategy’s robustness and profitability.
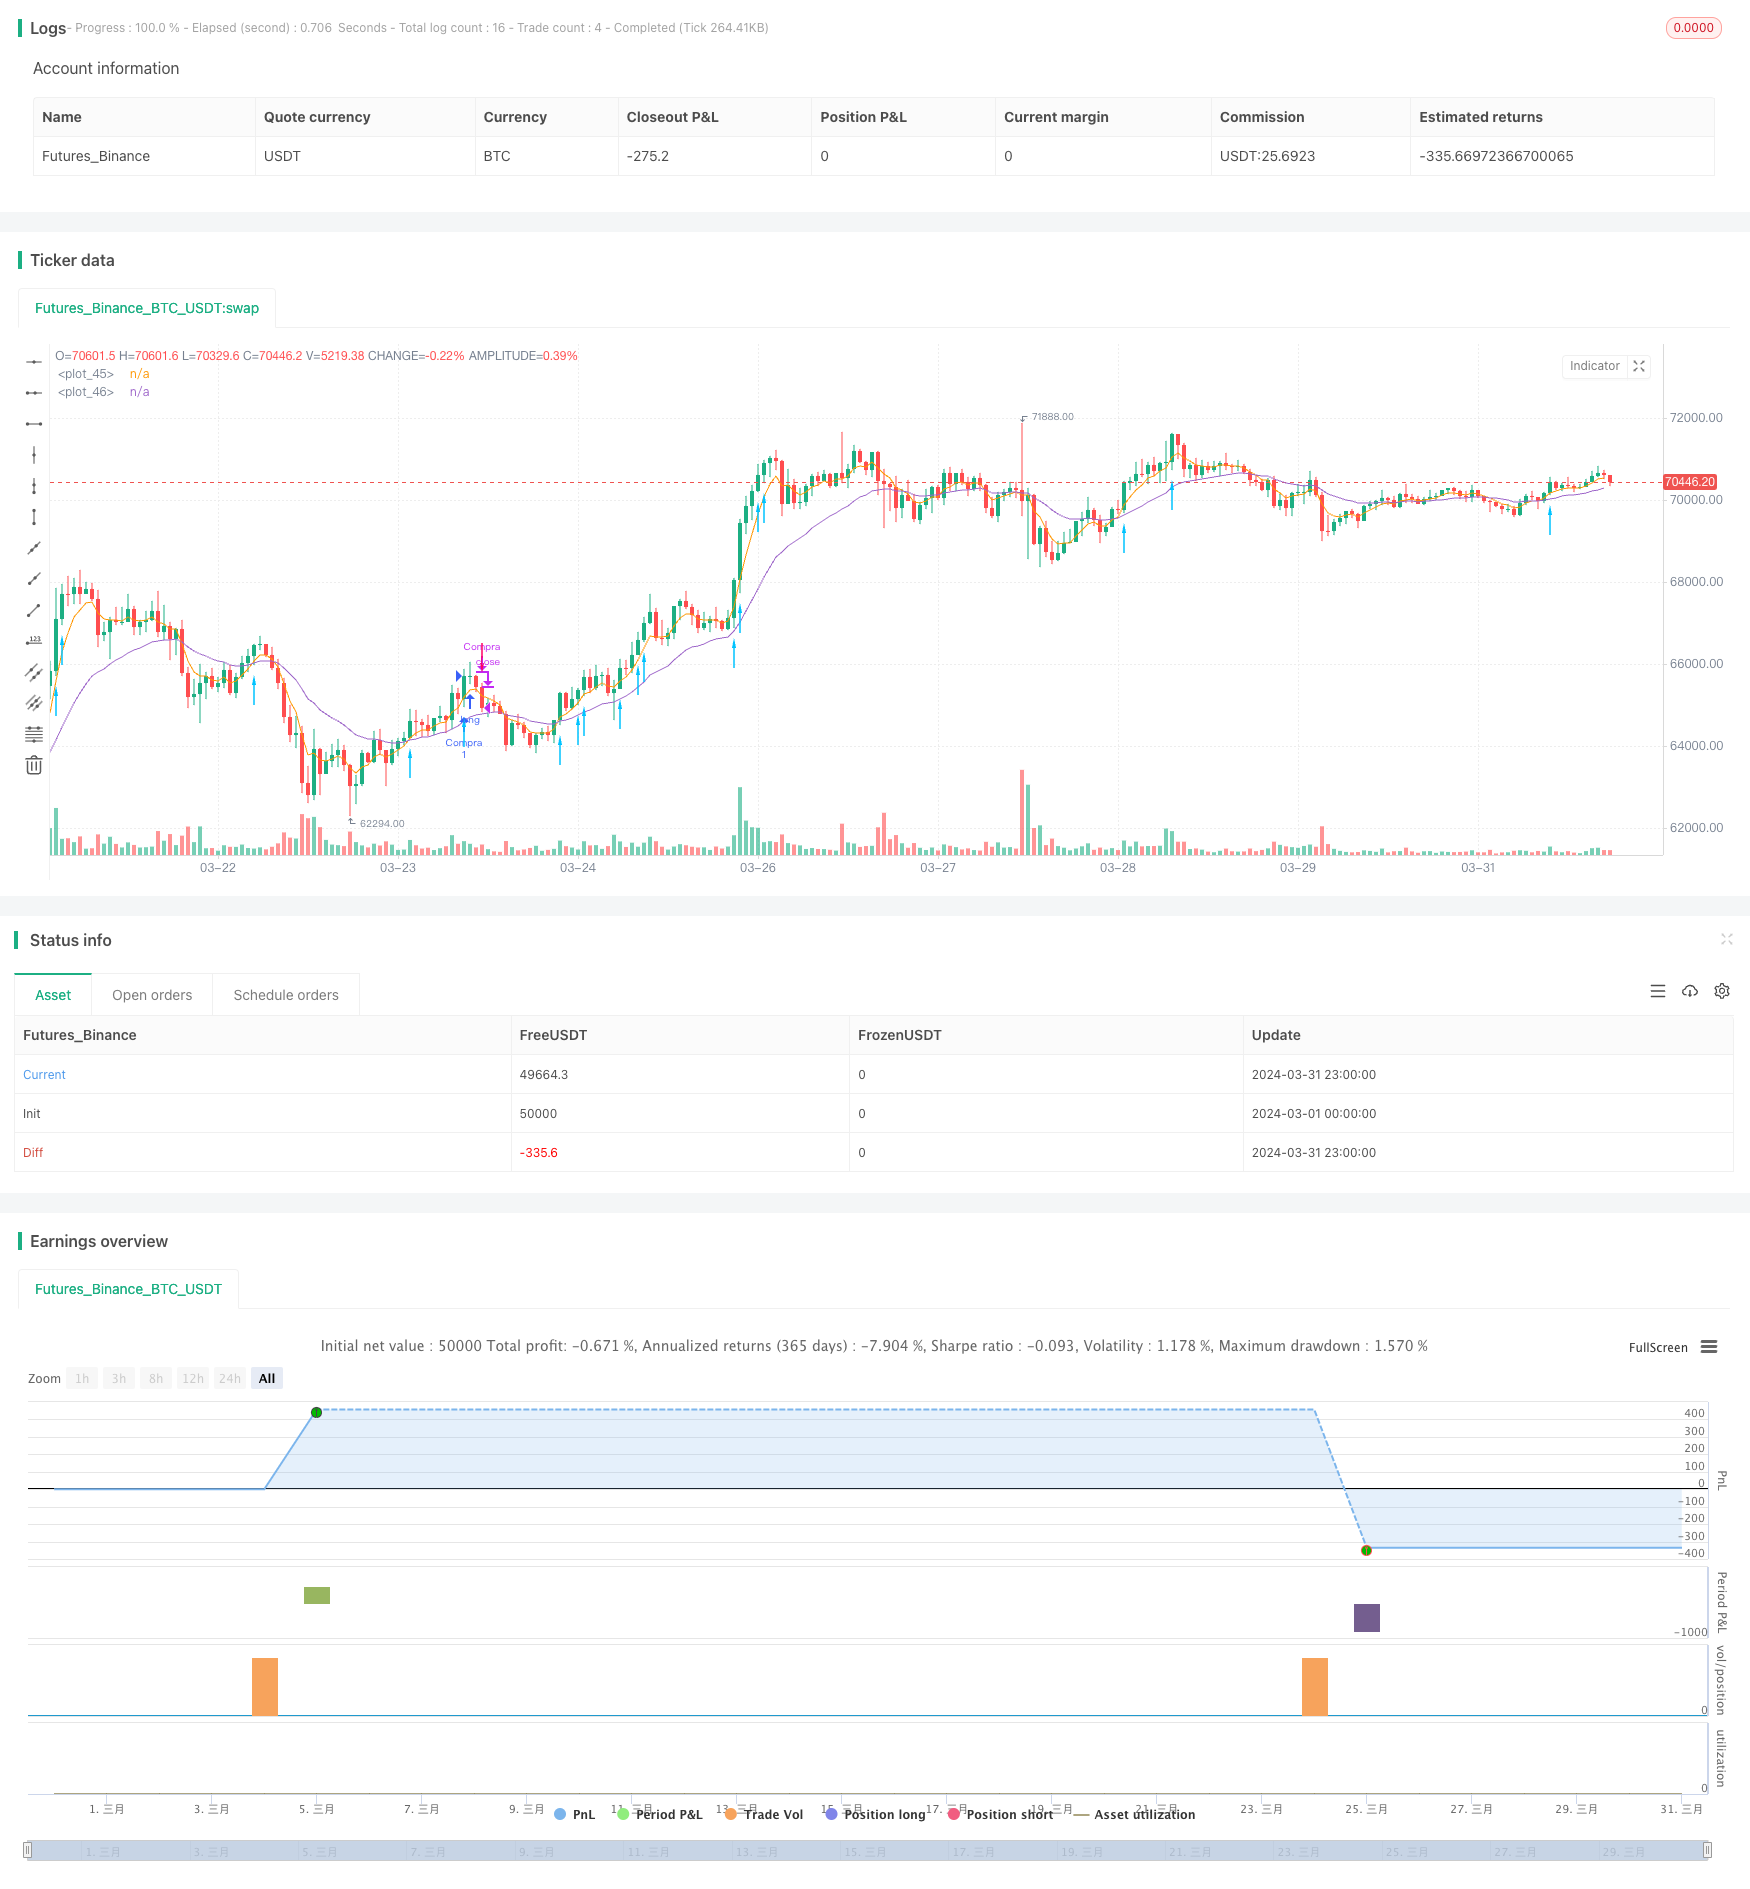
/*backtest
start: 2024-03-01 00:00:00
end: 2024-03-31 23:59:59
period: 1h
basePeriod: 15m
exchanges: [{"eid":"Futures_Binance","currency":"BTC_USDT"}]
*/

// This source code is subject to the terms of the Mozilla Public License 2.0 at https://mozilla.org/MPL/2.0/
// © lhcbenac

//@version=5
strategy('Ruda_Strategy', overlay=true , initial_capital=5000 , pyramiding = 3, commission_type =  strategy.commission.cash_per_contract , commission_value =  1 )

//
//
////////////////////////////////////////////////////////
//                                                    //
//                                                    //
//                    Otimizações                     //
//                                                    //
//                                                    //
////////////////////////////////////////////////////////
//
//

////////////////////////////////////////////////////////
//                                                    //
//                                                    //
//                 Codigo Operacional                 //
//                                                    //
//                                                    //
////////////////////////////////////////////////////////
//
//
// Indica situação de Compra ou Venda

// Condição True or False
YEAR_BT= input.int(1,title="Nº Anos ", group = "Backtest")

INPUT_ME1 = input.int(5,title="Momentum ", group = "RUDA")
INPUT_ME2 = input.int(21,title="Trend ", group = "RUDA")
INPUT_CORPO = input.int(50,title="CORPO ", group = "RUDA")/100


v_obv = ta.obv
v_med1 = ta.ema(close , INPUT_ME1)
v_med2 = ta.ema(close , INPUT_ME2)
valid_1 = v_med1 > v_med2
valid_2 = v_obv >= ta.highest(v_obv[1], 10)
valid_3 = math.abs(close - open) / (high-low) > INPUT_CORPO
plot(v_med1)
plot(v_med2)

compra = valid_1 and valid_2 and  strategy.position_size == 0 and valid_3


var float v_minima_ref = na

dataInicio = timestamp(year(timenow) - YEAR_BT, month(timenow), dayofmonth(timenow), 00, 00)

// Variáveis globais
var float preco_entrada = na
var float preco_stop = na

if compra and time >= dataInicio and ta.change(time("D")) != 0 and ta.change(compra)
    v_minima_ref := low
    preco_entrada := open
    preco_stop := math.min(low, open - 0.01 * open)
    strategy.entry("Compra", strategy.long , stop = preco_stop )
    if (not na(preco_entrada) and not na(preco_stop))
        label.new(x=bar_index, y= low * 0.9, text= "Dia: " + str.tostring(dayofmonth) + "\nPreço de Entrada: " + str.tostring(preco_entrada) + "\nPreço de Stop Loss: " + str.tostring(preco_stop), style=label.style_label_up, color=color.green)


// Lógica de saída
// Saída no stop loss
if (not na(preco_stop) and low < preco_stop and ta.change(low) < 0)
    strategy.close("Compra", comment="Saída no Stop")

// Saída no lucro
if (close < v_med1 and ta.change(close) < 0)
    strategy.close("Compra", comment="Saída na Media")

venda =( (not na(preco_stop) and low < preco_stop and ta.change(low) < 0) or (close < v_med1 and ta.change(close) < 0) ) and strategy.position_size > 0
codiff = compra ? 1 : venda ? -1 : na
plotarrow(codiff, colorup=#00c3ff, colordown=#ff0062,title="Compra", maxheight=20, offset=0)
- Moving Average Colored EMA/SMA
- Sidboss
- CM Sling Shot System
- Playing the cross
- Inverted Hammer - Extended Options
- Range Filter Buy and Sell 5min [Strategy]
- Buy/Sell Strat
- 3EMA
- stoch supertrd atr 200ma
- multiple timeframe trading
- N Bars Breakout Strategy
- Low-Risk Stable Cryptocurrency High-Frequency Trading Strategy Based on RSI and MACD
- Bollinger Bands Stochastic RSI Extreme Signal Strategy
- RSI Dual-Side Trading Strategy
- KRK ADA 1H Stochastic Slow Strategy with More Entries and AI
- Volume MA-based Adaptive Pyramiding Dynamic Stop Loss and Take Profit Trading Strategy
- MACD TEMA Crossover Strategy
- RSI and Bollinger Bands Double Strategy
- VWMA-ADX Momentum and Trend-Based Bitcoin Long Strategy
- Multi-Indicator Trend Following Dynamic Risk Management Strategy
- Dual Moving Average Crossover Strategy
- Modified Bollinger Bands Strategy
- Dynamic Threshold Price Change Breakout Strategy
- Dual Moving Average Lagging Breakout Strategy
- Momentum Trading with Dual Moving Average Crossover Strategy
- Multi-indicator BTC Trading Strategy
- TD Sequential Breakout and Retracement Buy/Sell Strategy
- SMA Crossover Compounding Strategy
- Volatility Trend Following Strategy
- Dual Moving Average and RSI-Based Short-Term Scalable Trend Following Strategy