Low-Risk Stable Cryptocurrency High-Frequency Trading Strategy Based on RSI and MACD
Author: ChaoZhang, Date: 2024-04-12 16:54:53Tags: RSIMACDMA
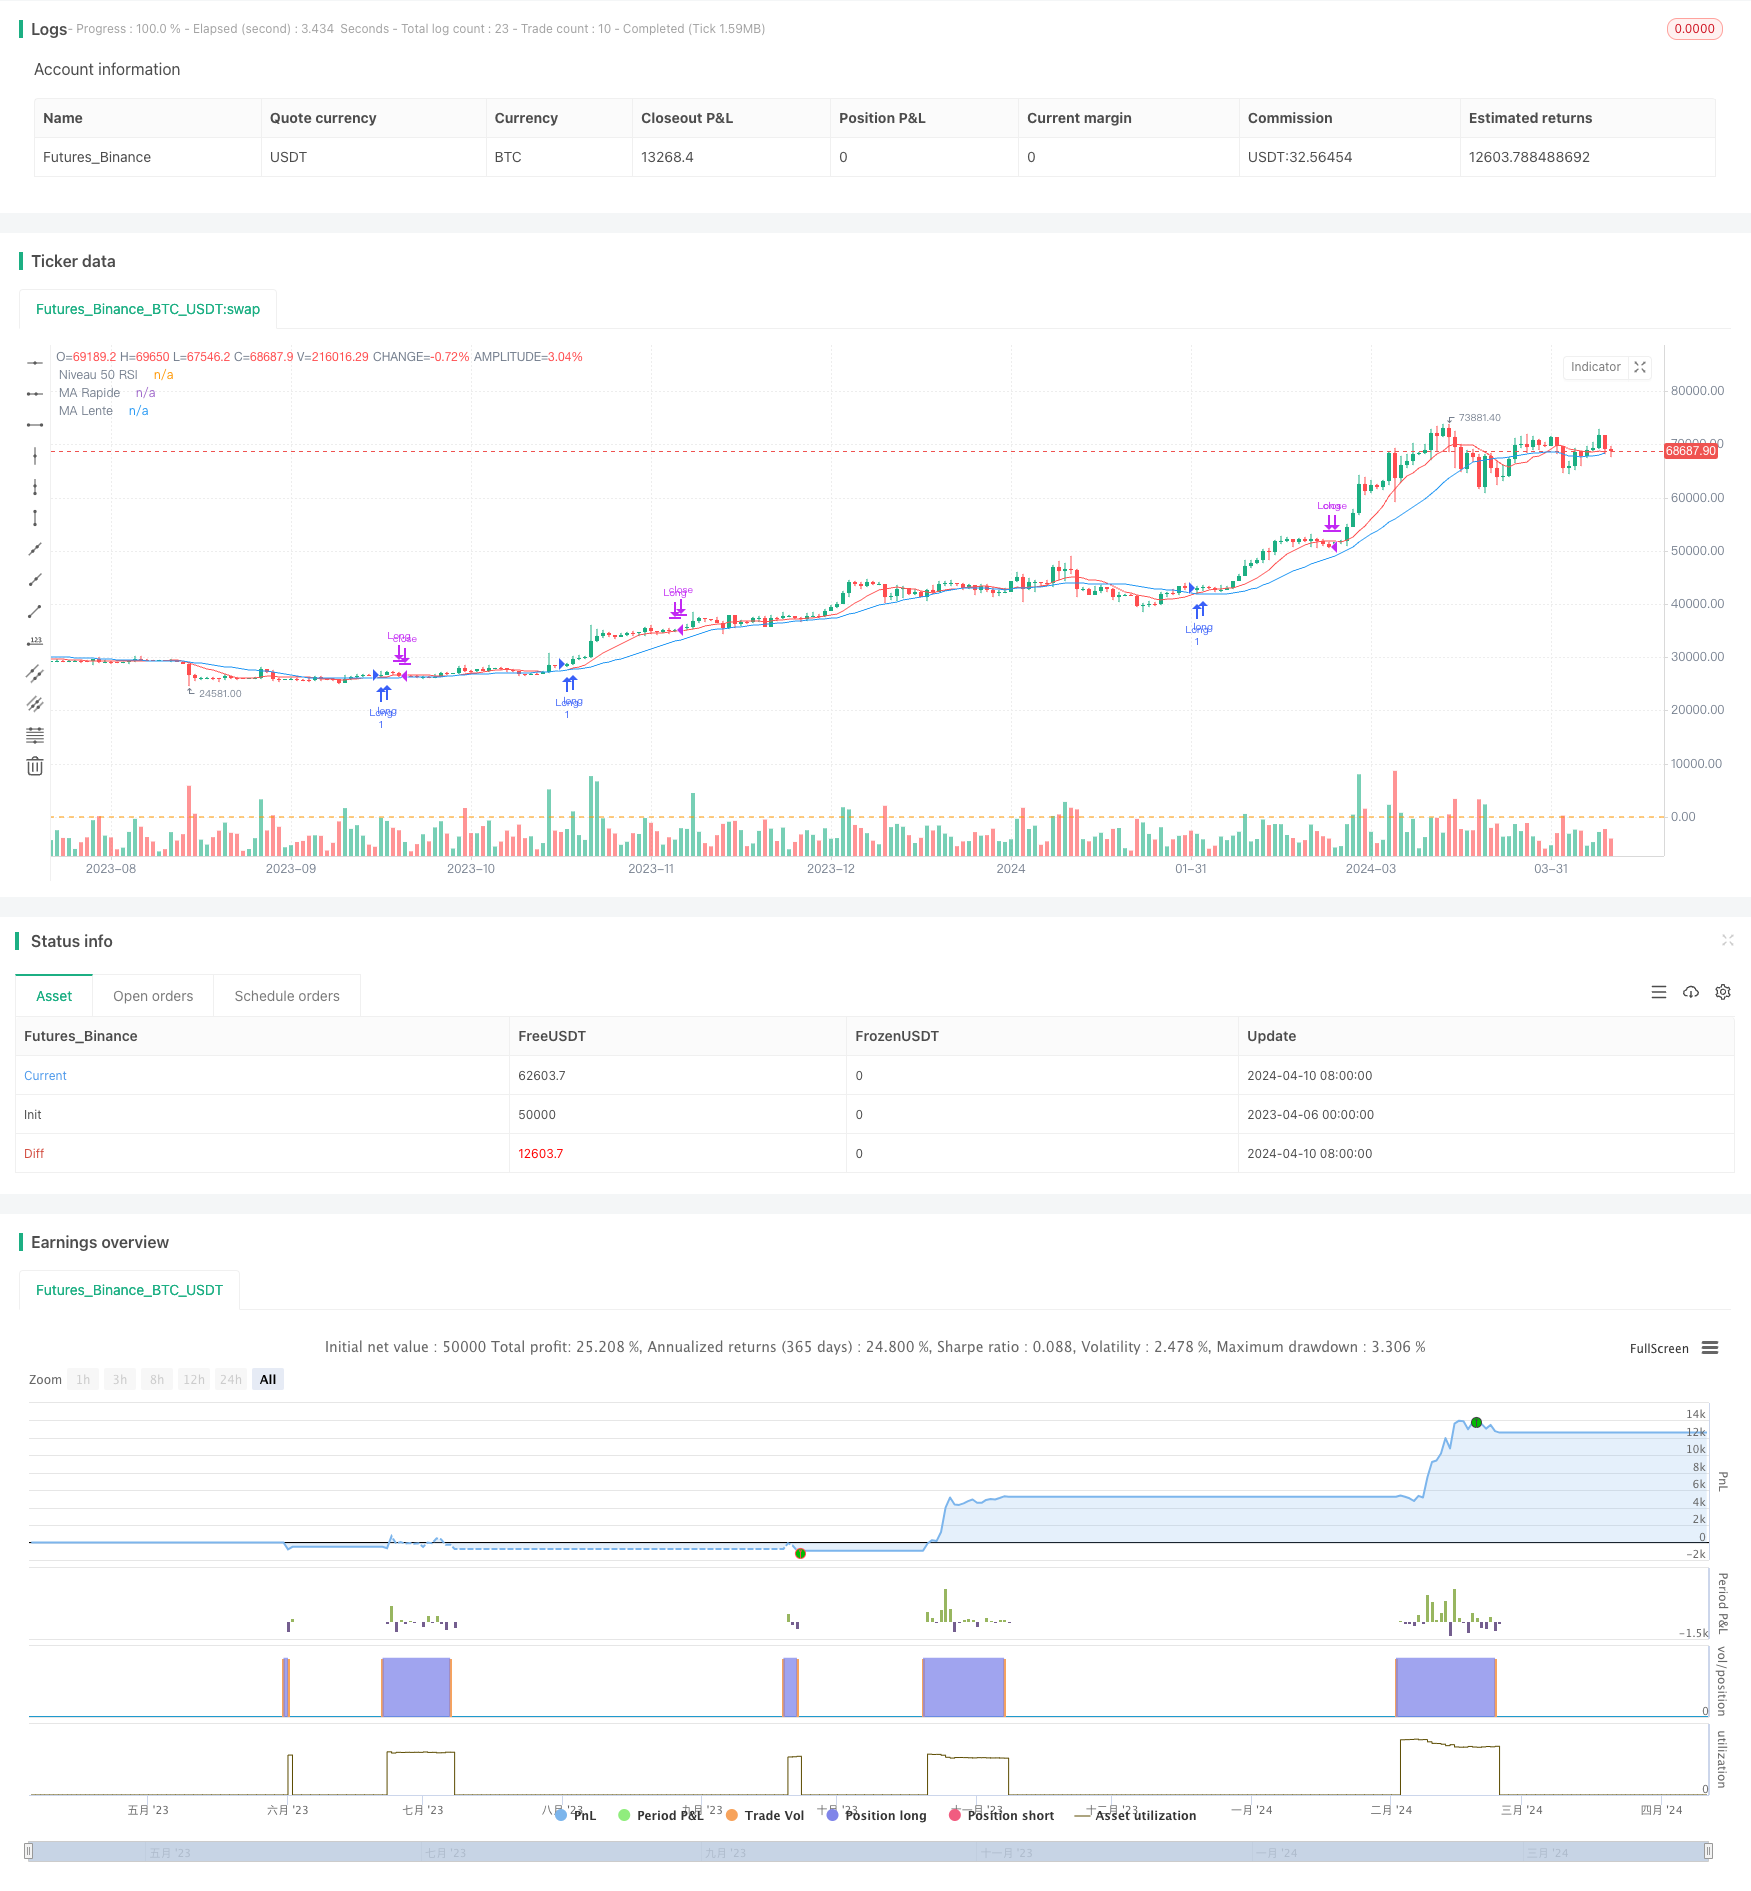
Overview
This strategy is a cryptocurrency high-frequency trading strategy based on the Relative Strength Index (RSI) and Moving Average Convergence Divergence (MACD) indicators. It uses two moving averages (MA) with different periods to determine the trend, and combines RSI and MACD indicators to confirm entry and exit signals. The strategy aims to achieve low-risk, stable profits.
Strategy Principle
- Calculate the fast MA and slow MA using 9 and 21 periods respectively.
- Calculate the RSI indicator with a 14-period.
- Calculate the MACD indicator with a fast period of 12, a slow period of 26, and a signal period of 9.
- When the fast MA crosses above the slow MA, and RSI is greater than 50, and the MACD fast line is greater than the signal line, open a long position.
- When the fast MA crosses below the slow MA, or RSI is less than 50, or the MACD fast line is less than the signal line, close the long position.
Strategy Advantages
- Combining multiple indicators to confirm signals, improving entry accuracy and reducing false signal risk.
- Using MAs with different periods to determine trends, adapting to different market conditions.
- Strict stop-loss conditions, closing positions once the trend reverses or momentum weakens, effectively controlling drawdowns.
- High-frequency trading with multiple trades, moderate profit/loss ratio per trade, accumulating small gains for steady growth.
Strategy Risks
- In a choppy market, MA crossovers may occur frequently, leading to excessive trading and increased transaction costs.
- Both RSI and MACD are lagging indicators, which may result in delayed signals and missed optimal entry opportunities.
- The strategy parameters are fixed and lack dynamic adjustment, which may not adapt to market changes.
Strategy Optimization Directions
- Introduce volatility indicators, such as ATR, to increase stop-loss levels and reduce trading frequency in high-volatility markets.
- Optimize the parameters of RSI and MACD indicators to find the best combination and improve signal accuracy.
- Incorporate position management, dynamically adjusting positions based on market trend strength and account profitability to improve risk-adjusted returns.
- Combine other types of indicators, such as volume-price indicators and pattern indicators, to build a multi-factor model and enhance strategy robustness.
Summary
This strategy is a high-frequency trading strategy based on MA, RSI, and MACD indicators. By using strict signal confirmation and stop-loss conditions, it can achieve stable, low-risk returns in trending markets. However, it may face frequent trading issues in choppy markets and also has the risk of lagging signals. Future optimizations can be made in areas such as parameter optimization, dynamic position management, and multi-factor models to improve adaptability and risk-adjusted returns.
/*backtest
start: 2023-04-06 00:00:00
end: 2024-04-11 00:00:00
period: 1d
basePeriod: 1h
exchanges: [{"eid":"Futures_Binance","currency":"BTC_USDT"}]
*/

//@version=5
strategy("Scalping Amélioré avec RSI et MACD", overlay=true)

// Paramètres des indicateurs
fastLength = input(9, title="Longueur MA Rapide")
slowLength = input(21, title="Longueur MA Lente")
rsiLength = input(14, title="Longueur RSI")
macdFast = input(12, title="MACD Rapide")
macdSlow = input(26, title="MACD Lent")
macdSignal = input(9, title="Signal MACD")

// Calcul des indicateurs
fastMA = ta.sma(close, fastLength)
slowMA = ta.sma(close, slowLength)
rsi = ta.rsi(close, rsiLength)
[macdLine, signalLine, _] = ta.macd(close, macdFast, macdSlow, macdSignal)

// Conditions d'entrée
longCondition = ta.crossover(fastMA, slowMA) and rsi > 50 and macdLine > signalLine
if (longCondition)
    strategy.entry("Long", strategy.long)

// Conditions de sortie
exitCondition = ta.crossunder(fastMA, slowMA) or rsi < 50 or macdLine < signalLine
if (exitCondition)
    strategy.close("Long")

// Affichage des indicateurs
plot(fastMA, color=color.red, title="MA Rapide")
plot(slowMA, color=color.blue, title="MA Lente")
hline(50, "Niveau 50 RSI", color=color.orange)
- Multi-Indicator Trend Following Strategy
- Elliott Wave Theory 4-9 Impulse Wave Automatic Detection Trading Strategy
- Best TradingView Strategy
- Price Divergence Strategy v1.0
- MACD and RSI Combined Long-term Trading Strategy
- OBV MACD Indicator
- Johny's BOT
- AlphaTradingBot Trading Strategy
- Multi-Indicator Trend Following Dynamic Risk Management Strategy
- VuManChu Cipher B + Divergences Strategy
- BBSR Extreme Strategy
- High-Frequency Reversal Trading Strategy Based on Momentum RSI Indicator
- RSI Relative Strength Index Strategy
- Bollinger Bands Breakout Strategy
- Donchian Channel and Larry Williams Large Trade Index Strategy
- SPARK Dynamic Position Sizing and Dual Indicator Trading Strategy
- Moving Average Crossover + MACD Slow Line Momentum Strategy
- Volume-based Dynamic DCA Strategy
- MACD Valley Detector Strategy
- N Bars Breakout Strategy
- Bollinger Bands Stochastic RSI Extreme Signal Strategy
- RSI Dual-Side Trading Strategy
- KRK ADA 1H Stochastic Slow Strategy with More Entries and AI
- Volume MA-based Adaptive Pyramiding Dynamic Stop Loss and Take Profit Trading Strategy
- MACD TEMA Crossover Strategy
- RSI and Bollinger Bands Double Strategy
- VWMA-ADX Momentum and Trend-Based Bitcoin Long Strategy
- Multi-Indicator Trend Following Dynamic Risk Management Strategy
- Ruda Momentum Trend Trading Strategy
- Dual Moving Average Crossover Strategy