RSI and Bollinger Bands Double Strategy
Author: ChaoZhang, Date: 2024-04-03 17:54:52Tags: RSIBBSMAstdev
Overview
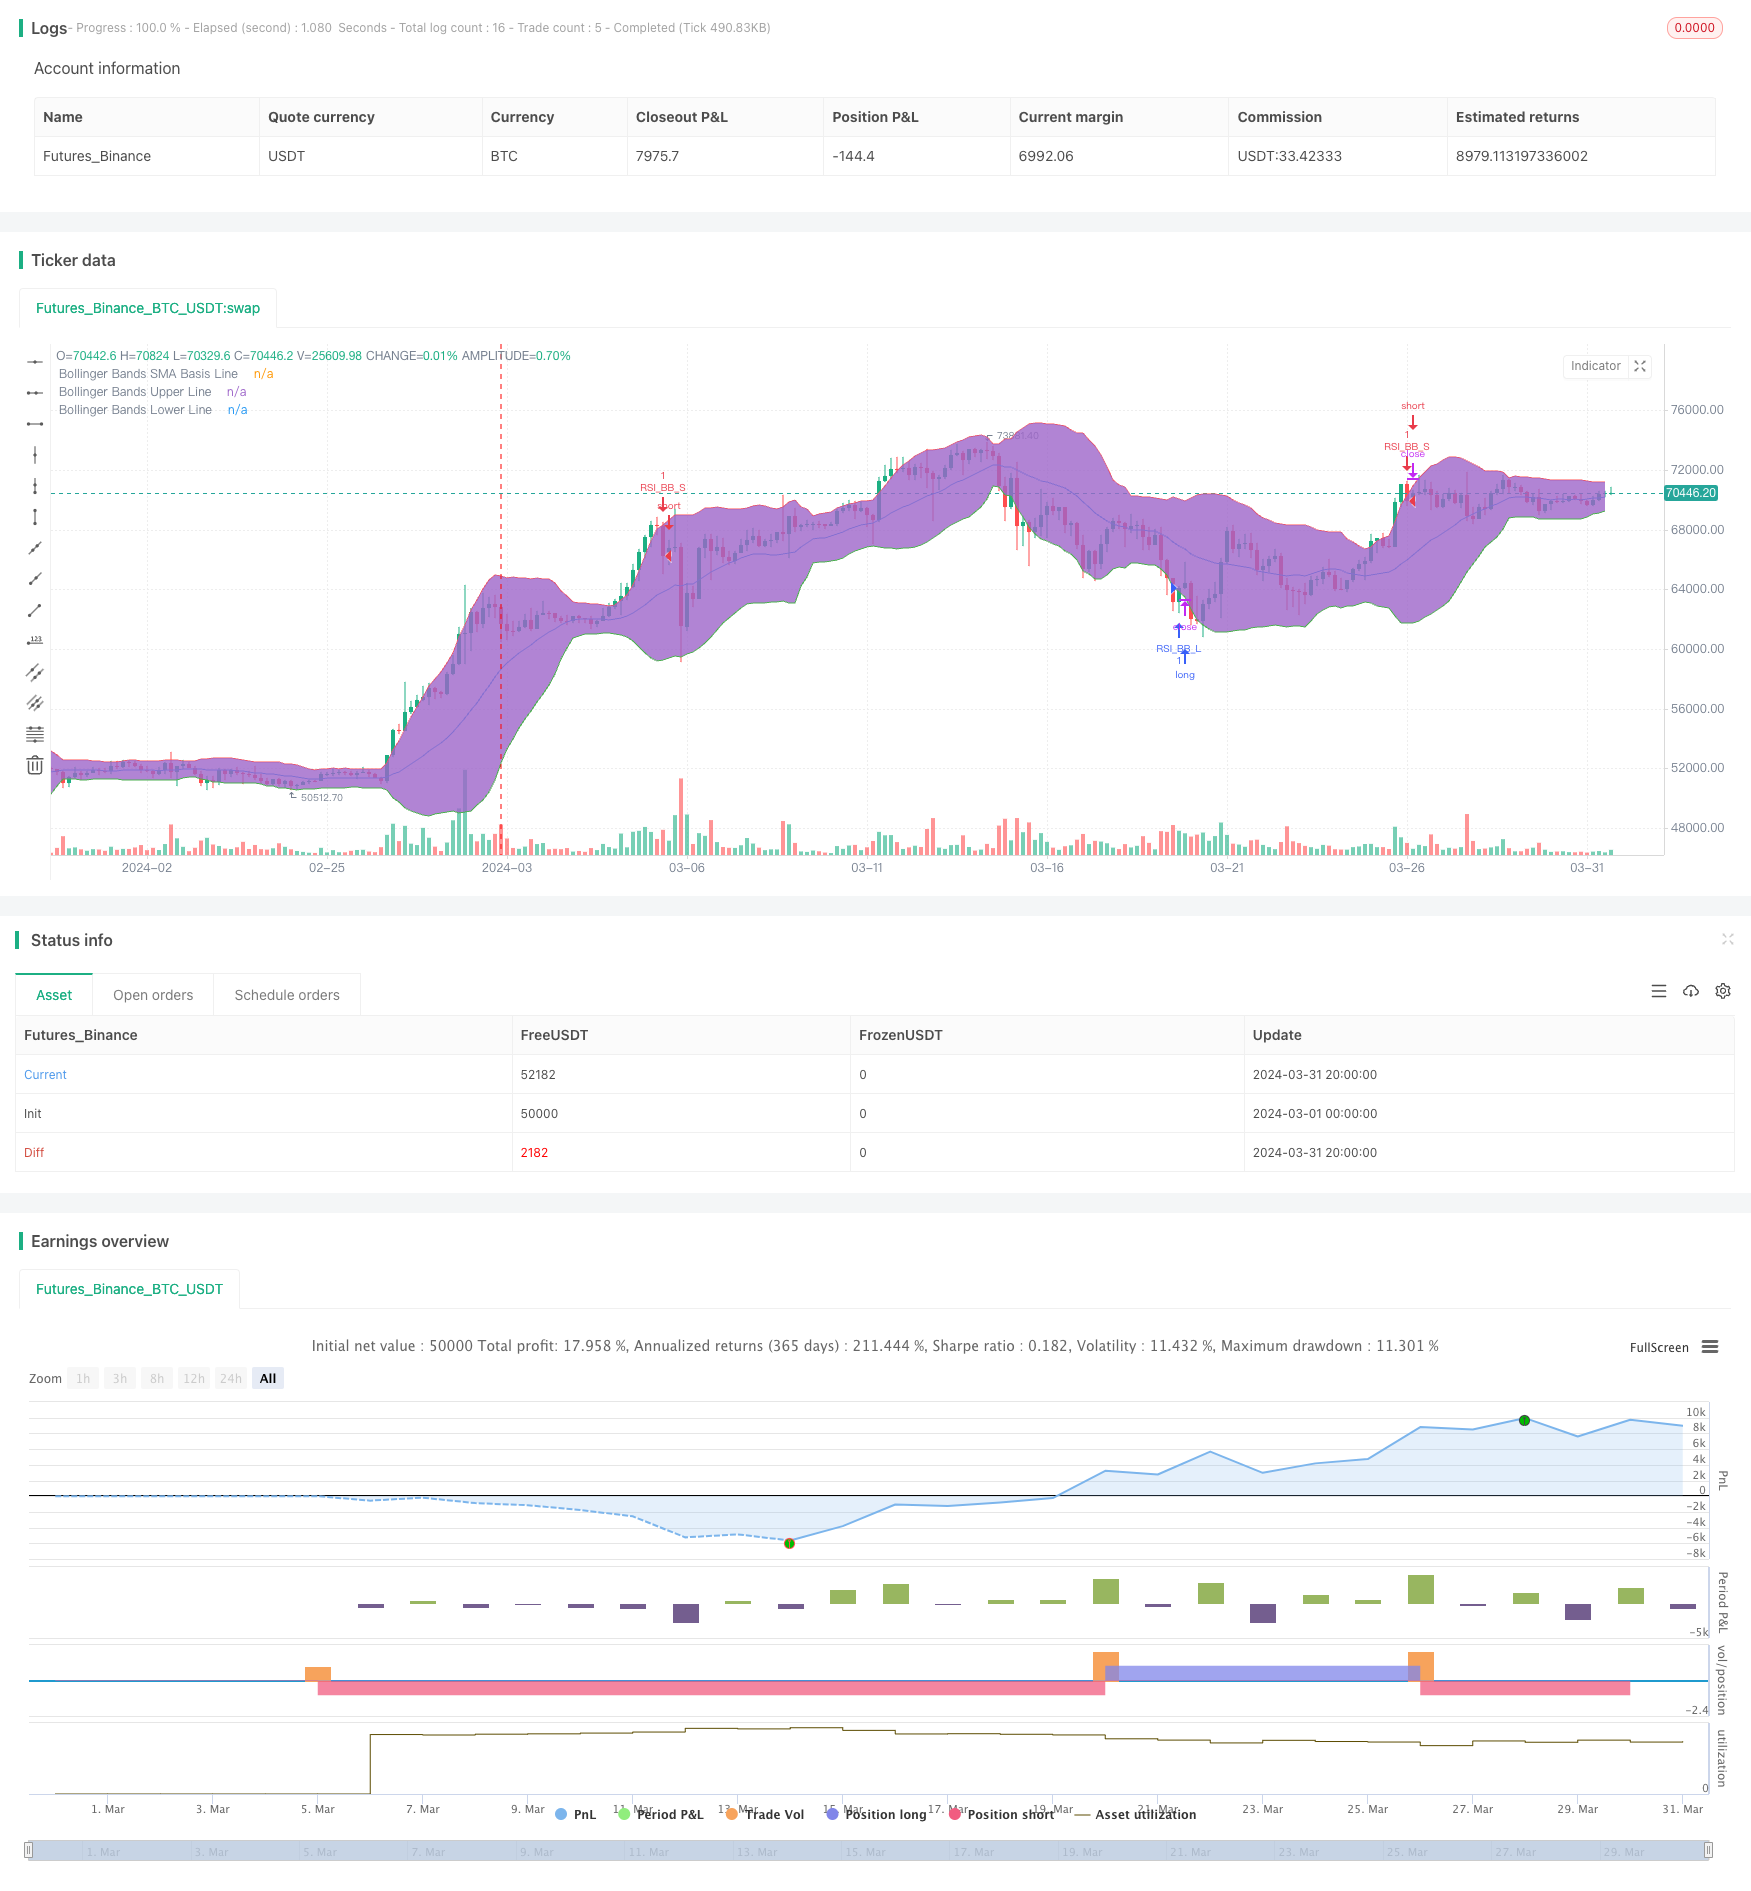
This strategy combines the Relative Strength Index (RSI) and Bollinger Bands technical indicators. It generates buy signals when the price falls below the lower Bollinger Band and sell signals when the price rises above the upper Bollinger Band. The strategy only triggers trading signals when both the RSI and Bollinger Bands indicators are simultaneously in an oversold or overbought state.
Strategy Logic
- Calculate the RSI value based on the set RSI parameters.
- Use the Bollinger Bands formula to calculate the middle, upper, and lower Bollinger Bands.
- Determine if the current closing price breaks through the upper or lower Bollinger Band.
- Determine if the current RSI value is above the overbought threshold or below the oversold threshold.
- Generate corresponding buy or sell signals when both the Bollinger Bands and RSI indicators meet the respective conditions.
Strategy Advantages
- Combines trend and momentum indicators for a more comprehensive assessment of market conditions.
- Using two indicators as filters effectively reduces the probability of false signals.
- Clear code logic and flexible parameter settings, suitable for different market environments and trading styles.
Strategy Risks
- In choppy markets, this strategy may generate more losing trades.
- Improper parameter settings may lead to poor strategy performance and require optimization based on actual conditions.
- The strategy does not include a stop-loss, potentially exposing it to significant drawdown risk.
Strategy Optimization Directions
- Optimize RSI and Bollinger Bands parameters based on market characteristics and personal preferences.
- Introduce additional technical indicators such as MACD, moving averages, etc., to improve signal reliability.
- Set reasonable stop-loss and take-profit levels to control single-trade risk.
- For choppy markets, consider adding more conditions or reducing position size to lower costs associated with frequent trading.
Summary
The RSI and Bollinger Bands Double Strategy combines trend and momentum indicators to provide a relatively comprehensive assessment of market conditions and generate corresponding trading signals. However, the strategy may underperform in choppy markets and lacks risk control measures, so caution is needed when applying it to live trading. By optimizing parameters, introducing other indicators, and setting reasonable stop-loss and take-profit levels, the stability and profitability of this strategy can be further improved.
/*backtest
start: 2024-03-01 00:00:00
end: 2024-03-31 23:59:59
period: 4h
basePeriod: 15m
exchanges: [{"eid":"Futures_Binance","currency":"BTC_USDT"}]
*/

//@version=4
strategy("Bollinger + RSI, Double Strategy (by ChartArt) v1.1", shorttitle="CA_-_RSI_Bol_Strat_1.1", overlay=true)

// ChartArt's RSI + Bollinger Bands, Double Strategy - Update
//
// Version 1.1
// Idea by ChartArt on January 18, 2015.
//
// This strategy uses the RSI indicator
// together with the Bollinger Bands
// to sell when the price is above the
// upper Bollinger Band (and to buy when
// this value is below the lower band).
//
// This simple strategy only triggers when
// both the RSI and the Bollinger Bands
// indicators are at the same time in
// a overbought or oversold condition.
//
// In this version 1.1 the strategy was
// both simplified for the user and
// made more successful in backtesting.
//
// List of my work:
// https://www.tradingview.com/u/ChartArt/
//
//  __             __  ___       __  ___
// /  ` |__|  /\  |__)  |   /\  |__)  |
// \__, |  | /~~\ |  \  |  /~~\ |  \  |
//
//

///////////// RSI
RSIlength = input(14,title="RSI Period Length")
RSIoverSold = 30
RSIoverBought = 70
price = close
vrsi = rsi(price, RSIlength)


///////////// Bollinger Bands
BBlength = input(20, minval=1,title="Bollinger Period Length")
BBmult = input(2.0, minval=0.001, maxval=50,title="Bollinger Bands Standard Deviation")
BBbasis = sma(price, BBlength)
BBdev = BBmult * stdev(price, BBlength)
BBupper = BBbasis + BBdev
BBlower = BBbasis - BBdev
source = close
buyEntry = crossover(source, BBlower)
sellEntry = crossunder(source, BBupper)
plot(BBbasis, color=color.blue,title="Bollinger Bands SMA Basis Line")
p1 = plot(BBupper, color=color.red,title="Bollinger Bands Upper Line")
p2 = plot(BBlower, color=color.green,title="Bollinger Bands Lower Line")
fill(p1, p2)

// Entry conditions
crossover_rsi = crossover(vrsi, RSIoverSold) and crossover(source, BBlower)
crossunder_rsi = crossunder(vrsi, RSIoverBought) and crossunder(source, BBupper)

///////////// RSI + Bollinger Bands Strategy
if (not na(vrsi))
    if (crossover_rsi)
        strategy.entry("RSI_BB_L", strategy.long, comment="RSI_BB_L")
    else
        strategy.cancel(id="RSI_BB_L")

    if (crossunder_rsi)
        strategy.entry("RSI_BB_S", strategy.short, comment="RSI_BB_S")
    else
        strategy.cancel(id="RSI_BB_S")
- Bollinger Bands Breakout Strategy
- Bollinger Bands Breakout Strategy
- BBSR Extreme Strategy
- Intraday BUY/SELL
- RSI2 Strategy Intraday Reversal Win Rate Backtest
- BB-RSI-ADX Entry Points
- RSI Dual-Side Trading Strategy
- SWING TRADE SIGNALS
- QQE MOD + SSL Hybrid + Waddah Attar Explosion
- Vegas SuperTrend Enhanced Strategy
- Moving Average Crossover + MACD Slow Line Momentum Strategy
- Volume-based Dynamic DCA Strategy
- MACD Valley Detector Strategy
- N Bars Breakout Strategy
- Low-Risk Stable Cryptocurrency High-Frequency Trading Strategy Based on RSI and MACD
- Bollinger Bands Stochastic RSI Extreme Signal Strategy
- RSI Dual-Side Trading Strategy
- KRK ADA 1H Stochastic Slow Strategy with More Entries and AI
- Volume MA-based Adaptive Pyramiding Dynamic Stop Loss and Take Profit Trading Strategy
- MACD TEMA Crossover Strategy
- VWMA-ADX Momentum and Trend-Based Bitcoin Long Strategy
- Multi-Indicator Trend Following Dynamic Risk Management Strategy
- Ruda Momentum Trend Trading Strategy
- Dual Moving Average Crossover Strategy
- Modified Bollinger Bands Strategy
- Dynamic Threshold Price Change Breakout Strategy
- Dual Moving Average Lagging Breakout Strategy
- Momentum Trading with Dual Moving Average Crossover Strategy
- Multi-indicator BTC Trading Strategy
- TD Sequential Breakout and Retracement Buy/Sell Strategy