Bollinger Bands Breakout Strategy
Author: ChaoZhang, Date: 2024-04-12 17:31:39Tags: BBSMAstdev
Overview
The strategy is based on the Bollinger Bands indicator. It captures market trends by going short when the price touches the upper band and going long when it touches the lower band. Additionally, the strategy introduces the concept of pyramiding, where it will continue to add positions in the original direction if the number of positions has not reached the set maximum.
Strategy Principle
Bollinger Bands consists of three lines. The middle band is the simple moving average of the closing price. The upper and lower bands are a certain number of standard deviations above and below the middle band. Since prices always fluctuate around the mean, the upper and lower bands of the Bollinger Bands can be seen as a pressure range for prices. When the price breaks through the upper band, it indicates a strong upward trend and a long position can be taken; a break below the lower band indicates a strong downward trend and a short position can be taken. At the same time, when the number of positions is less than the set maximum, the strategy will continue to add positions on the basis of the original position, amplifying the intensity of trend capture.
Strategy Advantages
- Bollinger Bands is a widely used and validated technical indicator with strong trend capture capabilities.
- Entering positions when the price breaks through the upper and lower bands can effectively reduce the risk of false breakouts.
- The pyramiding approach can amplify the intensity of trend capture and increase profit potential.
- The code logic is clear and concise, easy to understand and implement.
Strategy Risks
- Bollinger Bands is a lagging indicator. In fast-moving markets, there may be signal lag.
- If not handled properly, pyramiding can lead to the accumulation of many small losses in choppy markets.
- Unreasonable parameter settings will affect strategy performance and need to be optimized based on different market characteristics.
Strategy Optimization Directions
- Consider introducing multiple Bollinger Bands combinations, such as Bollinger Bands with different timeframes and parameters, to improve signal reliability.
- After a trend signal appears, dynamic adjustment of the quantity and frequency of position additions can be made through volatility indicators such as ATR to reduce the impact of choppy markets.
- On the basis of Bollinger Bands, combine with other indicators such as MACD and RSI to construct multi-factor entry conditions and improve the accuracy of entry signals.
- Further optimize exit conditions, such as setting trailing stops and profit-taking, to reduce the risk exposure of a single trade.
Summary
The strategy utilizes the trend characteristics of Bollinger Bands. By entering positions when the price touches the upper and lower bands, and amplifying the intensity of trend capture through pyramiding, the overall idea is simple and effective. However, it also has certain lag and parameter sensitivity. In practical applications, attention needs to be paid to optimizing parameters and position management. Consideration can also be given to combining it with other signal indicators in order to obtain more robust strategy performance.
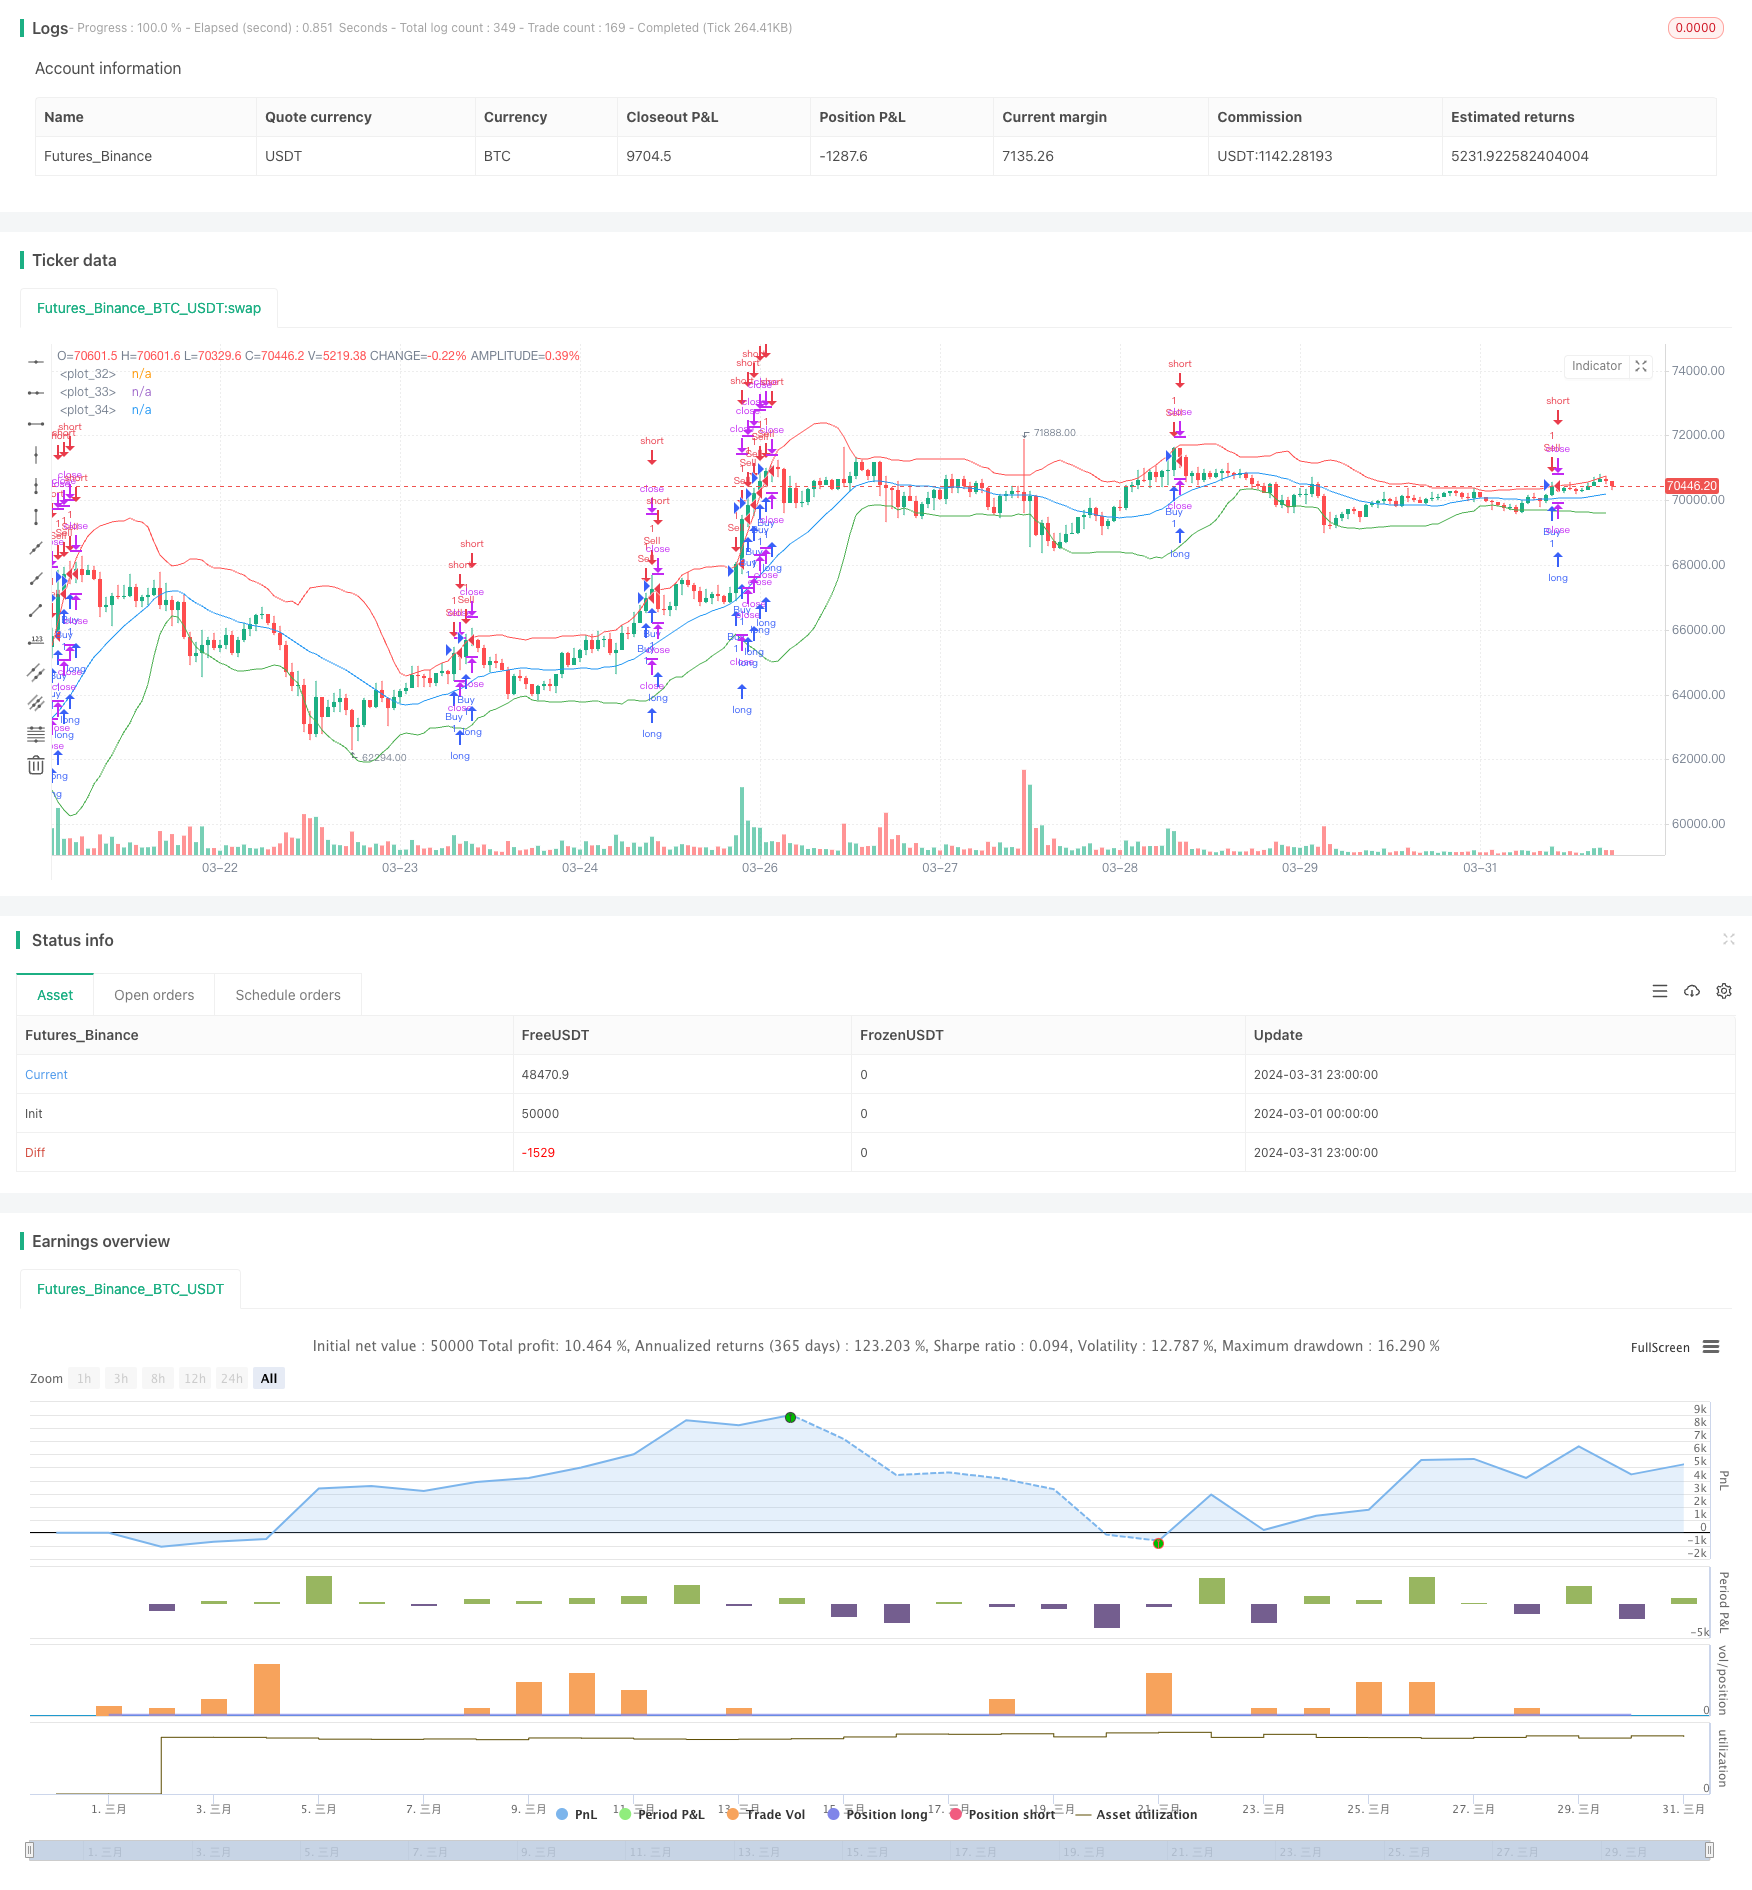
/*backtest
start: 2024-03-01 00:00:00
end: 2024-03-31 23:59:59
period: 1h
basePeriod: 15m
exchanges: [{"eid":"Futures_Binance","currency":"BTC_USDT"}]
*/

//@version=5
strategy("Bollinger Bands Breakout Strategy", overlay=true)

// Définition des paramètres
length = input(20, title="Bollinger Bands Length")
multiplier = input(2.0, title="Multiplier")
pyramiding = input(5, title="Pyramiding")

// Calcul des bandes de Bollinger
basis = ta.sma(close, length)
dev = multiplier * ta.stdev(close, length)
upper_band = basis + dev
lower_band = basis - dev

// Règles d'entrée
buy_signal = close <= lower_band
sell_signal = close >= upper_band

// Gestion des positions
if (buy_signal)
    strategy.entry("Buy", strategy.long)
if (sell_signal)
    strategy.entry("Sell", strategy.short)

// Pyramiding
if (strategy.opentrades < pyramiding)
    strategy.entry("Buy", strategy.long)
else if (strategy.opentrades > pyramiding)
    strategy.entry("Sell", strategy.short)

// Tracé des bandes de Bollinger
plot(basis, color=color.blue)
plot(upper_band, color=color.red)
plot(lower_band, color=color.green)
- Bollinger Bands Breakout Strategy
- RSI and Bollinger Bands Double Strategy
- BB-RSI-ADX Entry Points
- Vegas SuperTrend Enhanced Strategy
- MACD BB Breakout Strategy
- BBSR Extreme Strategy
- Squeeze Momentum Indicator
- Dual Timeframe Momentum Strategy
- NMVOB-S
- MTF RSI & STOCH Strategy
- Bollinger Bands Breakout Strategy
- Dual Timeframe Momentum Strategy
- MACD BB Breakout Strategy
- Wavetrend Large Amplitude Oversold Rebound Grid Trading Strategy
- MACD Crossover Strategy
- Optimized MACD Trend-Following Strategy with ATR-based Risk Management
- ZeroLag MACD Long Short Strategy
- BBSR Extreme Strategy
- High-Frequency Reversal Trading Strategy Based on Momentum RSI Indicator
- RSI Relative Strength Index Strategy
- Donchian Channel and Larry Williams Large Trade Index Strategy
- SPARK Dynamic Position Sizing and Dual Indicator Trading Strategy
- Moving Average Crossover + MACD Slow Line Momentum Strategy
- Volume-based Dynamic DCA Strategy
- MACD Valley Detector Strategy
- N Bars Breakout Strategy
- Low-Risk Stable Cryptocurrency High-Frequency Trading Strategy Based on RSI and MACD
- Bollinger Bands Stochastic RSI Extreme Signal Strategy
- RSI Dual-Side Trading Strategy
- KRK ADA 1H Stochastic Slow Strategy with More Entries and AI