SPARK Dynamic Position Sizing and Dual Indicator Trading Strategy
Author: ChaoZhang, Date: 2024-04-12 17:22:47Tags: supertrendRSIATR
Overview
The SPARK strategy is a quantitative trading strategy that combines dynamic position sizing with dual indicator confirmation. The strategy utilizes the SuperTrend indicator and the Relative Strength Index (RSI) to identify potential entry and exit points while employing a dynamic position sizing mechanism to optimize capital allocation. The strategy also offers flexible take profit and stop loss settings, as well as customizable parameters such as minimum trading frequency and directional preference.
Strategy Principles
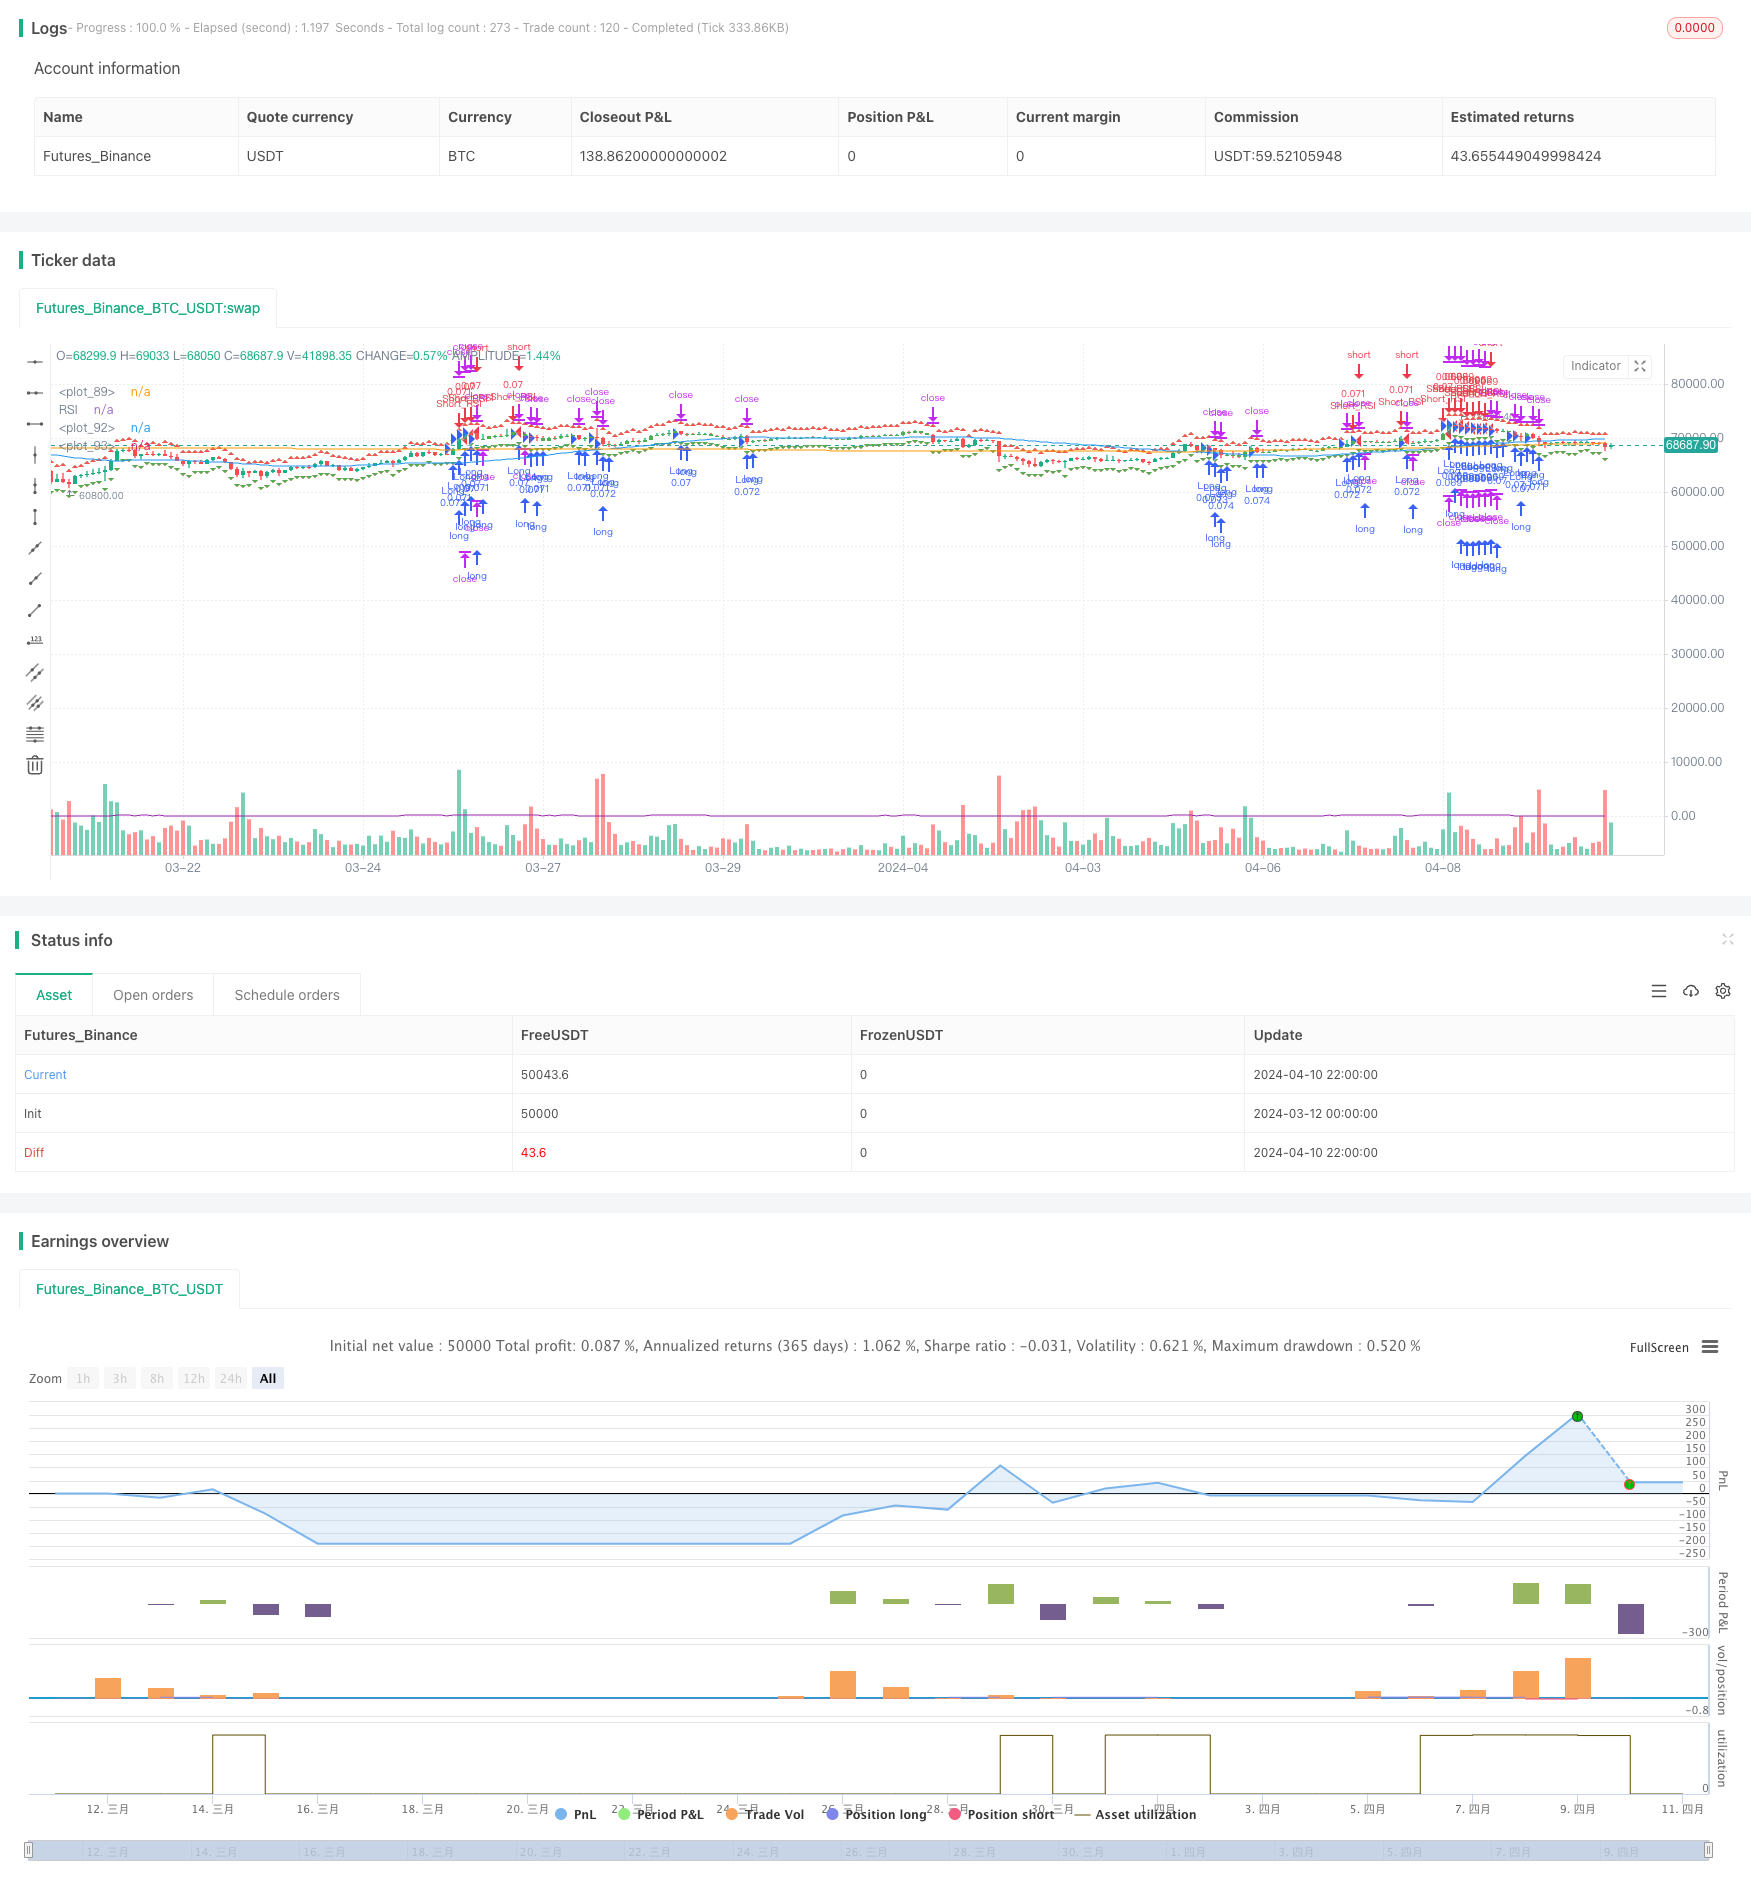
The core of the SPARK strategy lies in the combined application of the SuperTrend indicator and the RSI indicator. The SuperTrend indicator determines the trend direction by comparing the closing price with dynamic support and resistance levels, while the RSI indicator is used to identify overbought and oversold market conditions. When both the SuperTrend and RSI indicators simultaneously meet specific criteria, the strategy generates an entry signal.
The strategy employs a dynamic position sizing mechanism to optimize capital allocation for each trade. By setting a portfolio percentage and leverage ratio, the strategy automatically calculates the optimal position size based on current market conditions and account balance. Additionally, the strategy offers flexible take profit and stop loss settings, allowing users to choose between fixed percentages or dynamically calculated levels.
Strategy Advantages
- Dual Indicator Confirmation: By combining the SuperTrend and RSI indicators, the SPARK strategy can more accurately identify potential entry and exit points, reducing the likelihood of false signals.
- Dynamic Position Sizing: The strategy employs a dynamic position sizing mechanism that automatically optimizes capital allocation for each trade based on portfolio percentage and leverage ratio, enhancing capital efficiency.
- Flexible Risk Management: The strategy offers flexible take profit and stop loss settings, allowing users to choose between fixed percentages or dynamically calculated levels based on their risk preferences, enabling precise risk control.
- Customizable Parameters: The strategy allows users to adjust multiple input parameters, such as ATR length, multiplier, and RSI thresholds, to adapt to different market conditions and trading preferences.
Strategy Risks
- Market Risk: Despite the SPARK strategy’s dual indicator confirmation and dynamic position sizing mechanism, it may still face the risk of losses under extreme market conditions.
- Parameter Optimization Risk: The strategy’s performance largely depends on the selection of input parameters. Inappropriate parameter settings may lead to suboptimal strategy performance.
- Overfitting Risk: If the strategy parameters are over-optimized, it may result in poor performance under future market conditions.
Strategy Optimization Directions
- Incorporating Additional Indicators: Consider incorporating other technical indicators, such as MACD, Bollinger Bands, etc., to further enhance the accuracy of signal confirmation.
- Optimizing Take Profit and Stop Loss Mechanisms: Explore more advanced take profit and stop loss strategies, such as trailing stops, dynamic take profit levels, etc., to better protect profits and limit losses.
- Adaptive Parameter Adjustment: Develop an adaptive mechanism that dynamically adjusts strategy parameters based on market conditions to adapt to the ever-changing market environment.
Summary
The SPARK strategy provides traders with a comprehensive quantitative trading solution by combining the SuperTrend and RSI indicators, employing a dynamic position sizing mechanism, and offering flexible risk management tools. Although the strategy may face certain risks, with continuous optimization and refinement, the SPARK strategy has the potential to deliver consistent performance across various market conditions.
/*backtest
start: 2024-03-12 00:00:00
end: 2024-04-11 00:00:00
period: 2h
basePeriod: 15m
exchanges: [{"eid":"Futures_Binance","currency":"BTC_USDT"}]
*/

//@version=4
strategy("SPARK", shorttitle="SPARK", overlay=true)

// Choose whether to activate the minimal bars in trade feature
minBarsEnabled = input(true, title="Activate Minimal Bars in Trade")
portfolioPercentage = input(10, title="Portfolio Percentage", minval=1, maxval=100)
// Leverage Input
leverage = input(1, title="Leverage", minval=1)

// Calculate position size according to portfolio percentage and leverage
positionSizePercent = portfolioPercentage / 100 * leverage
positionSize = (strategy.initial_capital / close) * positionSizePercent

// Take Profit and Stop Loss settings
useFixedTPSL = input(1, title="Use Fixed TP/SL", options=[1, 0])
tp_sl_step = 0.1
fixedTP = input(2.0, title="Fixed Take Profit (%)", step=tp_sl_step)
fixedSL = input(1.0, title="Fixed Stop Loss (%)", step=tp_sl_step)

// Calculate Take Profit and Stop Loss Levels
takeProfitLong = close * (1 + fixedTP / 100)
takeProfitShort = close * (1 - fixedTP / 100)
stopLossLong = close * (1 - fixedSL / 100)
stopLossShort = close * (1 + fixedSL / 100)

// Plot TP and SL levels on the chart
plotshape(series=takeProfitLong, title="Take Profit Long", color=color.green, style=shape.triangleup, location=location.abovebar)
plotshape(series=takeProfitShort, title="Take Profit Short", color=color.red, style=shape.triangledown, location=location.belowbar)
plotshape(series=stopLossLong, title="Stop Loss Long", color=color.red, style=shape.triangleup, location=location.abovebar)
plotshape(series=stopLossShort, title="Stop Loss Short", color=color.green, style=shape.triangledown, location=location.belowbar)

// Minimum Bars Between Trades Input
minBarsBetweenTrades = input(5, title="Minimum Bars Between Trades")

// Inputs for selecting trading direction
tradingDirection = input("Both", "Choose Trading Direction", options=["Long", "Short", "Both"])

// SuperTrend Function
trendFlow(src, atrLength, multiplier) =>
    atr = atr(atrLength)
    up = hl2 - (multiplier * atr)
    dn = hl2 + (multiplier * atr)
    trend = 1
    trend := nz(trend[1], 1)
    up := src > nz(up[1], 0) and src[1] > nz(up[1], 0) ? max(up, nz(up[1], 0)) : up
    dn := src < nz(dn[1], 0) and src[1] < nz(dn[1], 0) ? min(dn, nz(dn[1], 0)) : dn
    trend := src > nz(dn[1], 0) ? 1 : src < nz(up[1], 0)? -1 : nz(trend[1], 1)
    [up, dn, trend]

// Inputs for SuperTrend settings
atrLength1 = input(7, title="ATR Length for Trend 1")
multiplier1 = input(4.0, title="Multiplier for Trend 1")
atrLength2 = input(14, title="ATR Length for Trend 2")
multiplier2 = input(3.618, title="Multiplier for Trend 2")
atrLength3 = input(21, title="ATR Length for Trend 3")
multiplier3 = input(3.5, title="Multiplier for Trend 3")
atrLength4 = input(28, title="ATR Length for Trend 4")
multiplier4 = input(3.382, title="Multiplier for Trend 4")

// Calculate SuperTrend
[up1, dn1, trend1] = trendFlow(close, atrLength1, multiplier1)
[up2, dn2, trend2] = trendFlow(close, atrLength2, multiplier2)
[up3, dn3, trend3] = trendFlow(close, atrLength3, multiplier3)
[up4, dn4, trend4] = trendFlow(close, atrLength4, multiplier4)

// Entry Conditions based on SuperTrend and Elliott Wave-like patterns
longCondition = trend1 == 1 and trend2 == 1 and trend3 == 1 and trend4 == 1
shortCondition = trend1 == -1 and trend2 == -1 and trend3 == -1 and trend4 == -1

// Calculate bars since last trade
barsSinceLastTrade = barssince(tradingDirection == "Long" ? longCondition : shortCondition)

// Strategy Entry logic based on selected trading direction and minimum bars between trades
if tradingDirection == "Long" or tradingDirection == "Both"
    if longCondition and (not minBarsEnabled or barsSinceLastTrade >= minBarsBetweenTrades)
        strategy.entry("Long", strategy.long, qty=positionSize)
        strategy.exit("TP/SL Long", from_entry="Long", stop=stopLossLong, limit=takeProfitLong)

if tradingDirection == "Short" or tradingDirection == "Both"
    if shortCondition and (not minBarsEnabled or barsSinceLastTrade >= minBarsBetweenTrades)
        strategy.entry("Short", strategy.short, qty=positionSize)
        strategy.exit("TP/SL Short", from_entry="Short", stop=stopLossShort, limit=takeProfitShort)

// Color bars based on position
var color barColor = na
barColor := strategy.position_size > 0 ? color.green : strategy.position_size < 0 ? color.red : na

// Plot colored bars
plotcandle(open, high, low, close, color=barColor)

// Plot moving averages
plot(sma(close, 50), color=color.blue)
plot(sma(close, 200), color=color.orange)

// More customizable trading bot - adding a new indicator
// This indicator is the RSI (Relative Strength Index)

// RSI Inputs
rsi_length = input(14, title="RSI Length")
rsi_oversold = input(30, title="RSI Oversold")
rsi_overbought = input(70, title="RSI Overbought")

// Calculate RSI
rsi = rsi(close, rsi_length)

// Plot RSI
plot(rsi, color=color.purple, title="RSI")

// Entry Conditions based on RSI
rsi_long_condition = rsi < rsi_oversold
rsi_short_condition = rsi > rsi_overbought

// Strategy Entry logic based on RSI
if tradingDirection == "Long" or tradingDirection == "Both"
    if rsi_long_condition and (not minBarsEnabled or barsSinceLastTrade >= minBarsBetweenTrades)
        strategy.entry("Long_RSI", strategy.long, qty=positionSize)
        strategy.exit("TP/SL Long_RSI", from_entry="Long_RSI", stop=stopLossLong, limit=takeProfitLong)

if tradingDirection == "Short" or tradingDirection == "Both"
    if rsi_short_condition and (not minBarsEnabled or barsSinceLastTrade >= minBarsBetweenTrades)
        strategy.entry("Short_RSI", strategy.short, qty=positionSize)
        strategy.exit("TP/SL Short_RSI", from_entry="Short_RSI", stop=stopLossShort, limit=takeProfitShort)
- RSI Trend Reversal Strategy
- AlphaTradingBot Trading Strategy
- Multi-Indicator Trend Following Strategy
- MACD Valley Detector Strategy
- Enhanced EMA Crossover Strategy with RSI/MACD/ATR
- Multi-Indicator Trend Following Dynamic Risk Management Strategy
- Buy&Sell Strategy depends on AO+Stoch+RSI+ATR
- Trend-Following Variable Position Grid Strategy
- Super Scalper - 5 Min 15 Min
- Volume MA-based Adaptive Pyramiding Dynamic Stop Loss and Take Profit Trading Strategy
- MACD BB Breakout Strategy
- Wavetrend Large Amplitude Oversold Rebound Grid Trading Strategy
- MACD Crossover Strategy
- Optimized MACD Trend-Following Strategy with ATR-based Risk Management
- ZeroLag MACD Long Short Strategy
- BBSR Extreme Strategy
- High-Frequency Reversal Trading Strategy Based on Momentum RSI Indicator
- RSI Relative Strength Index Strategy
- Bollinger Bands Breakout Strategy
- Donchian Channel and Larry Williams Large Trade Index Strategy
- Moving Average Crossover + MACD Slow Line Momentum Strategy
- Volume-based Dynamic DCA Strategy
- MACD Valley Detector Strategy
- N Bars Breakout Strategy
- Low-Risk Stable Cryptocurrency High-Frequency Trading Strategy Based on RSI and MACD
- Bollinger Bands Stochastic RSI Extreme Signal Strategy
- RSI Dual-Side Trading Strategy
- KRK ADA 1H Stochastic Slow Strategy with More Entries and AI
- Volume MA-based Adaptive Pyramiding Dynamic Stop Loss and Take Profit Trading Strategy
- MACD TEMA Crossover Strategy