N Bars Breakout Strategy
Author: ChaoZhang, Date: 2024-04-12 16:57:15Tags:
Overview
The N Bars Breakout Strategy is a quantitative trading strategy based on price breakouts. The main idea of this strategy is to open a long position when the closing price breaks above the highest high of the past N bars, and close the long position when the closing price breaks below the lowest low of the past N bars. By comparing the current price with the highest and lowest prices of the past N bars, this strategy aims to capture strong breakout moves and achieve the effect of trend following.
Strategy Principle
- Calculate the highest high (highest) and lowest low (lowest) of the past N bars.
- If the current closing price is higher than the highest, open a long position (long).
- If the current closing price is lower than the lowest, close the long position (short).
- You can choose to use the closing price (close) or high/low price (high/low) as the signal source.
- Depending on the signal source, use ta.highest and ta.lowest to calculate the highest and lowest prices.
- Use ta.crossover and ta.crossunder to determine price breakouts.
Strategy Advantages
- Simple and clear logic, easy to implement and optimize.
- Can effectively capture strong breakout moves, with strong trend-following capability.
- Large room for parameter optimization, can be optimized for different instruments and timeframes.
- Wide applicability, performs well for most instruments and timeframes.
- Flexible choice of signal source, improving strategy adaptability.
Strategy Risks
- Performs poorly in choppy and small-fluctuation markets, with frequent opening and closing of positions leading to high transaction costs.
- Improper parameter selection may lead to overfitting risk.
- May experience large drawdowns during trend reversals.
- Single signal source may face the risk of signal distortion.
Strategy Optimization Directions
- Add trend filtering conditions, such as MA trend direction, ADX, etc., to reduce trading in choppy markets.
- Optimize parameter selection, such as N value, signal source, etc., to improve strategy stability and profitability.
- Add stop-loss and trailing stop-loss logic to control single-trade risk.
- Combine multiple signal sources to improve signal reliability, such as considering both closing price and high/low price breakouts.
- Optimize parameters and logic separately for different instruments and timeframes.
Summary
The N Bars Breakout Strategy is a simple and practical quantitative trading strategy that achieves good trend-following effects by capturing price breakouts. The strategy has clear logic, large optimization space, and wide applicability, making it a quantitative strategy worth further research and optimization. Through reasonable parameter optimization and logic improvement, the stability and profitability of this strategy can be further enhanced to better adapt to different market environments.
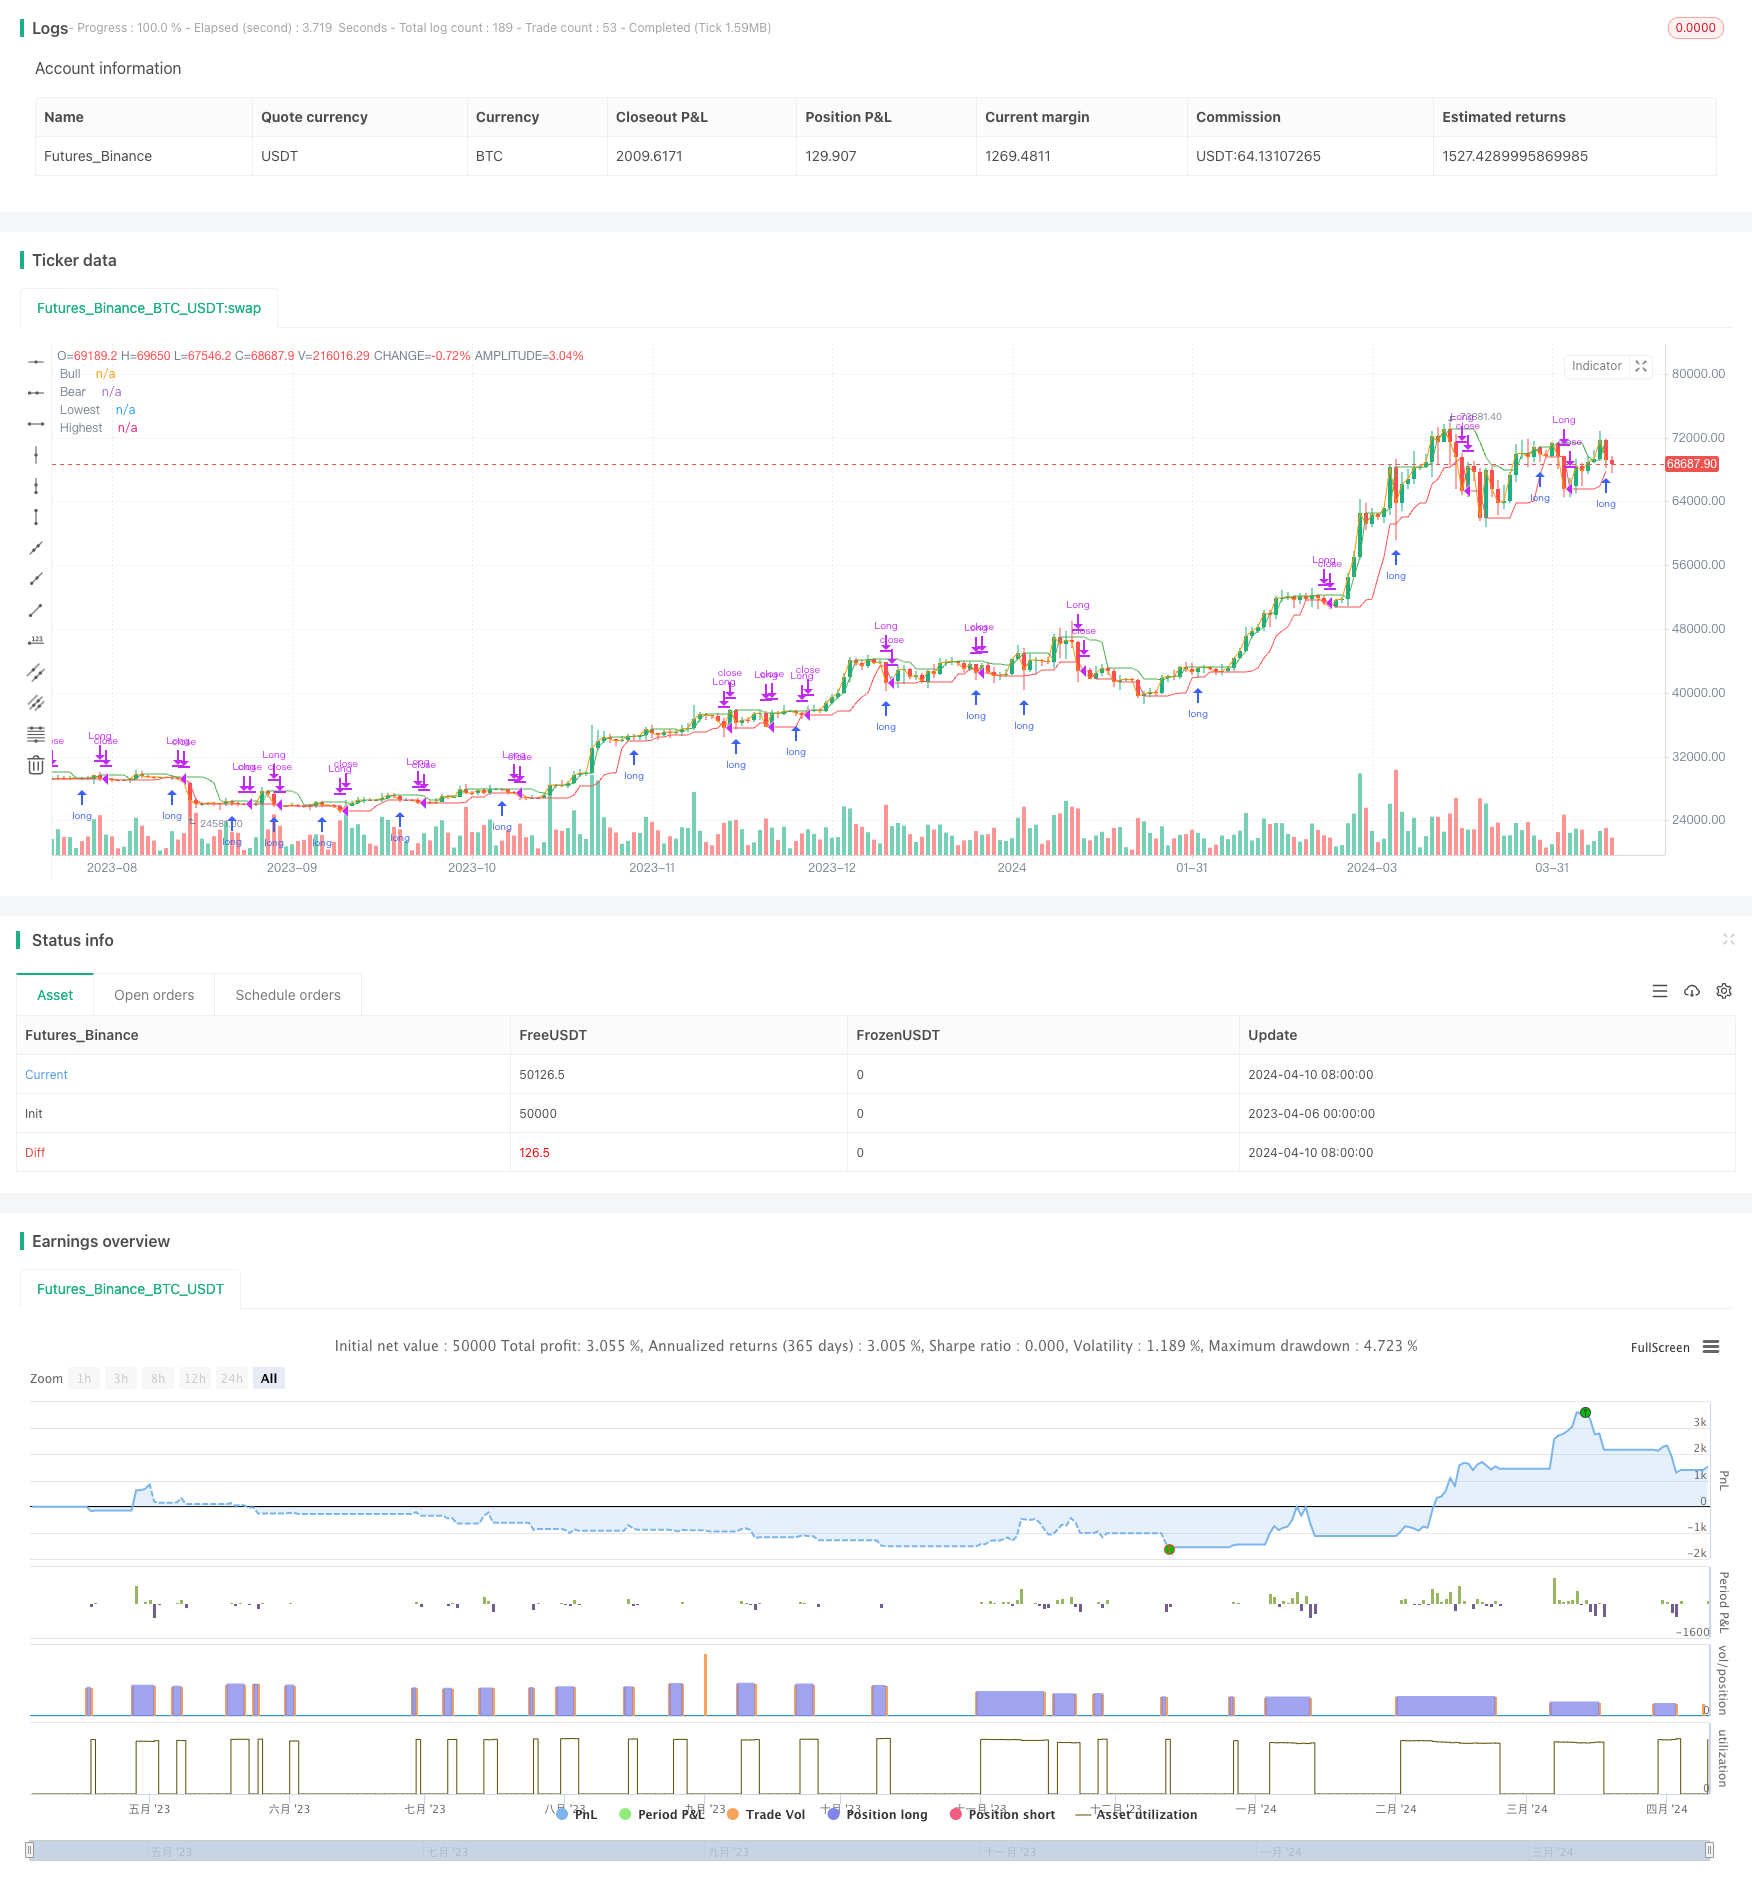
/*backtest
start: 2023-04-06 00:00:00
end: 2024-04-11 00:00:00
period: 1d
basePeriod: 1h
exchanges: [{"eid":"Futures_Binance","currency":"BTC_USDT"}]
*/

//@version=5
strategy("Breakout", overlay=true, precision=6, pyramiding=0, initial_capital=1000, default_qty_type=strategy.percent_of_equity, default_qty_value=25.0, commission_value=0.05)

n = input.int(5, "N Bars", minval=1)
src_input = input.string("Close", "Source", ["Close", "High/Low"])

bull_src = switch src_input
	"Close" => close
	"High/Low" => high
	=>
		runtime.error("Invalid source input")
		na

bear_src = switch src_input
	"Close" => close
	"High/Low" => low
	=>
		runtime.error("Invalid source input")
		na

highest = ta.highest(bull_src[1], n)
lowest = ta.lowest(bear_src[1], n)

//-----------------------------------------------------------------------------------------------------------------------------------------------------------------
// Plots
//-----------------------------------------------------------------------------------------------------------------------------------------------------------------

bool long = ta.crossover(bull_src, highest)
bool short = ta.crossunder(bear_src, lowest)

//Plots
lowest_plot  = plot(lowest,  color=color.red, title="Lowest")
highest_plot  = plot(highest,  color=color.green, title="Highest")
bull_src_plot = plot(bull_src, color=color.blue, title="Bull")
bear_src_plot = plot(bear_src, color=color.orange, title="Bear")

// this message is an alert that can be sent to a webhook, which allows for simple automation if you have a server that listens to alerts and trades programmatically.
enter_long_alert = '{"side": "Long", "order": "Enter", "price": ' + str.tostring(open) + ', "timestamp": ' + str.tostring(timenow) + '}'
exit_long_alert = '{"side": "Long", "order": "Exit", "price": ' + str.tostring(open) + ', "timestamp": ' + str.tostring(timenow) + '}'

if long
    strategy.entry(id="Long", direction=strategy.long, limit=open, alert_message=enter_long_alert)

if short
    strategy.close(id="Long", comment="Close Long", alert_message=exit_long_alert)
- ZeroLag MACD Long Short Strategy
- BBSR Extreme Strategy
- High-Frequency Reversal Trading Strategy Based on Momentum RSI Indicator
- RSI Relative Strength Index Strategy
- Bollinger Bands Breakout Strategy
- Donchian Channel and Larry Williams Large Trade Index Strategy
- SPARK Dynamic Position Sizing and Dual Indicator Trading Strategy
- Moving Average Crossover + MACD Slow Line Momentum Strategy
- Volume-based Dynamic DCA Strategy
- MACD Valley Detector Strategy
- Low-Risk Stable Cryptocurrency High-Frequency Trading Strategy Based on RSI and MACD
- Bollinger Bands Stochastic RSI Extreme Signal Strategy
- RSI Dual-Side Trading Strategy
- KRK ADA 1H Stochastic Slow Strategy with More Entries and AI
- Volume MA-based Adaptive Pyramiding Dynamic Stop Loss and Take Profit Trading Strategy
- MACD TEMA Crossover Strategy
- RSI and Bollinger Bands Double Strategy
- VWMA-ADX Momentum and Trend-Based Bitcoin Long Strategy
- Multi-Indicator Trend Following Dynamic Risk Management Strategy
- Ruda Momentum Trend Trading Strategy