MACD TEMA Crossover Strategy
Author: ChaoZhang, Date: 2024-04-03 18:25:32Tags: MACDTEMAEMA
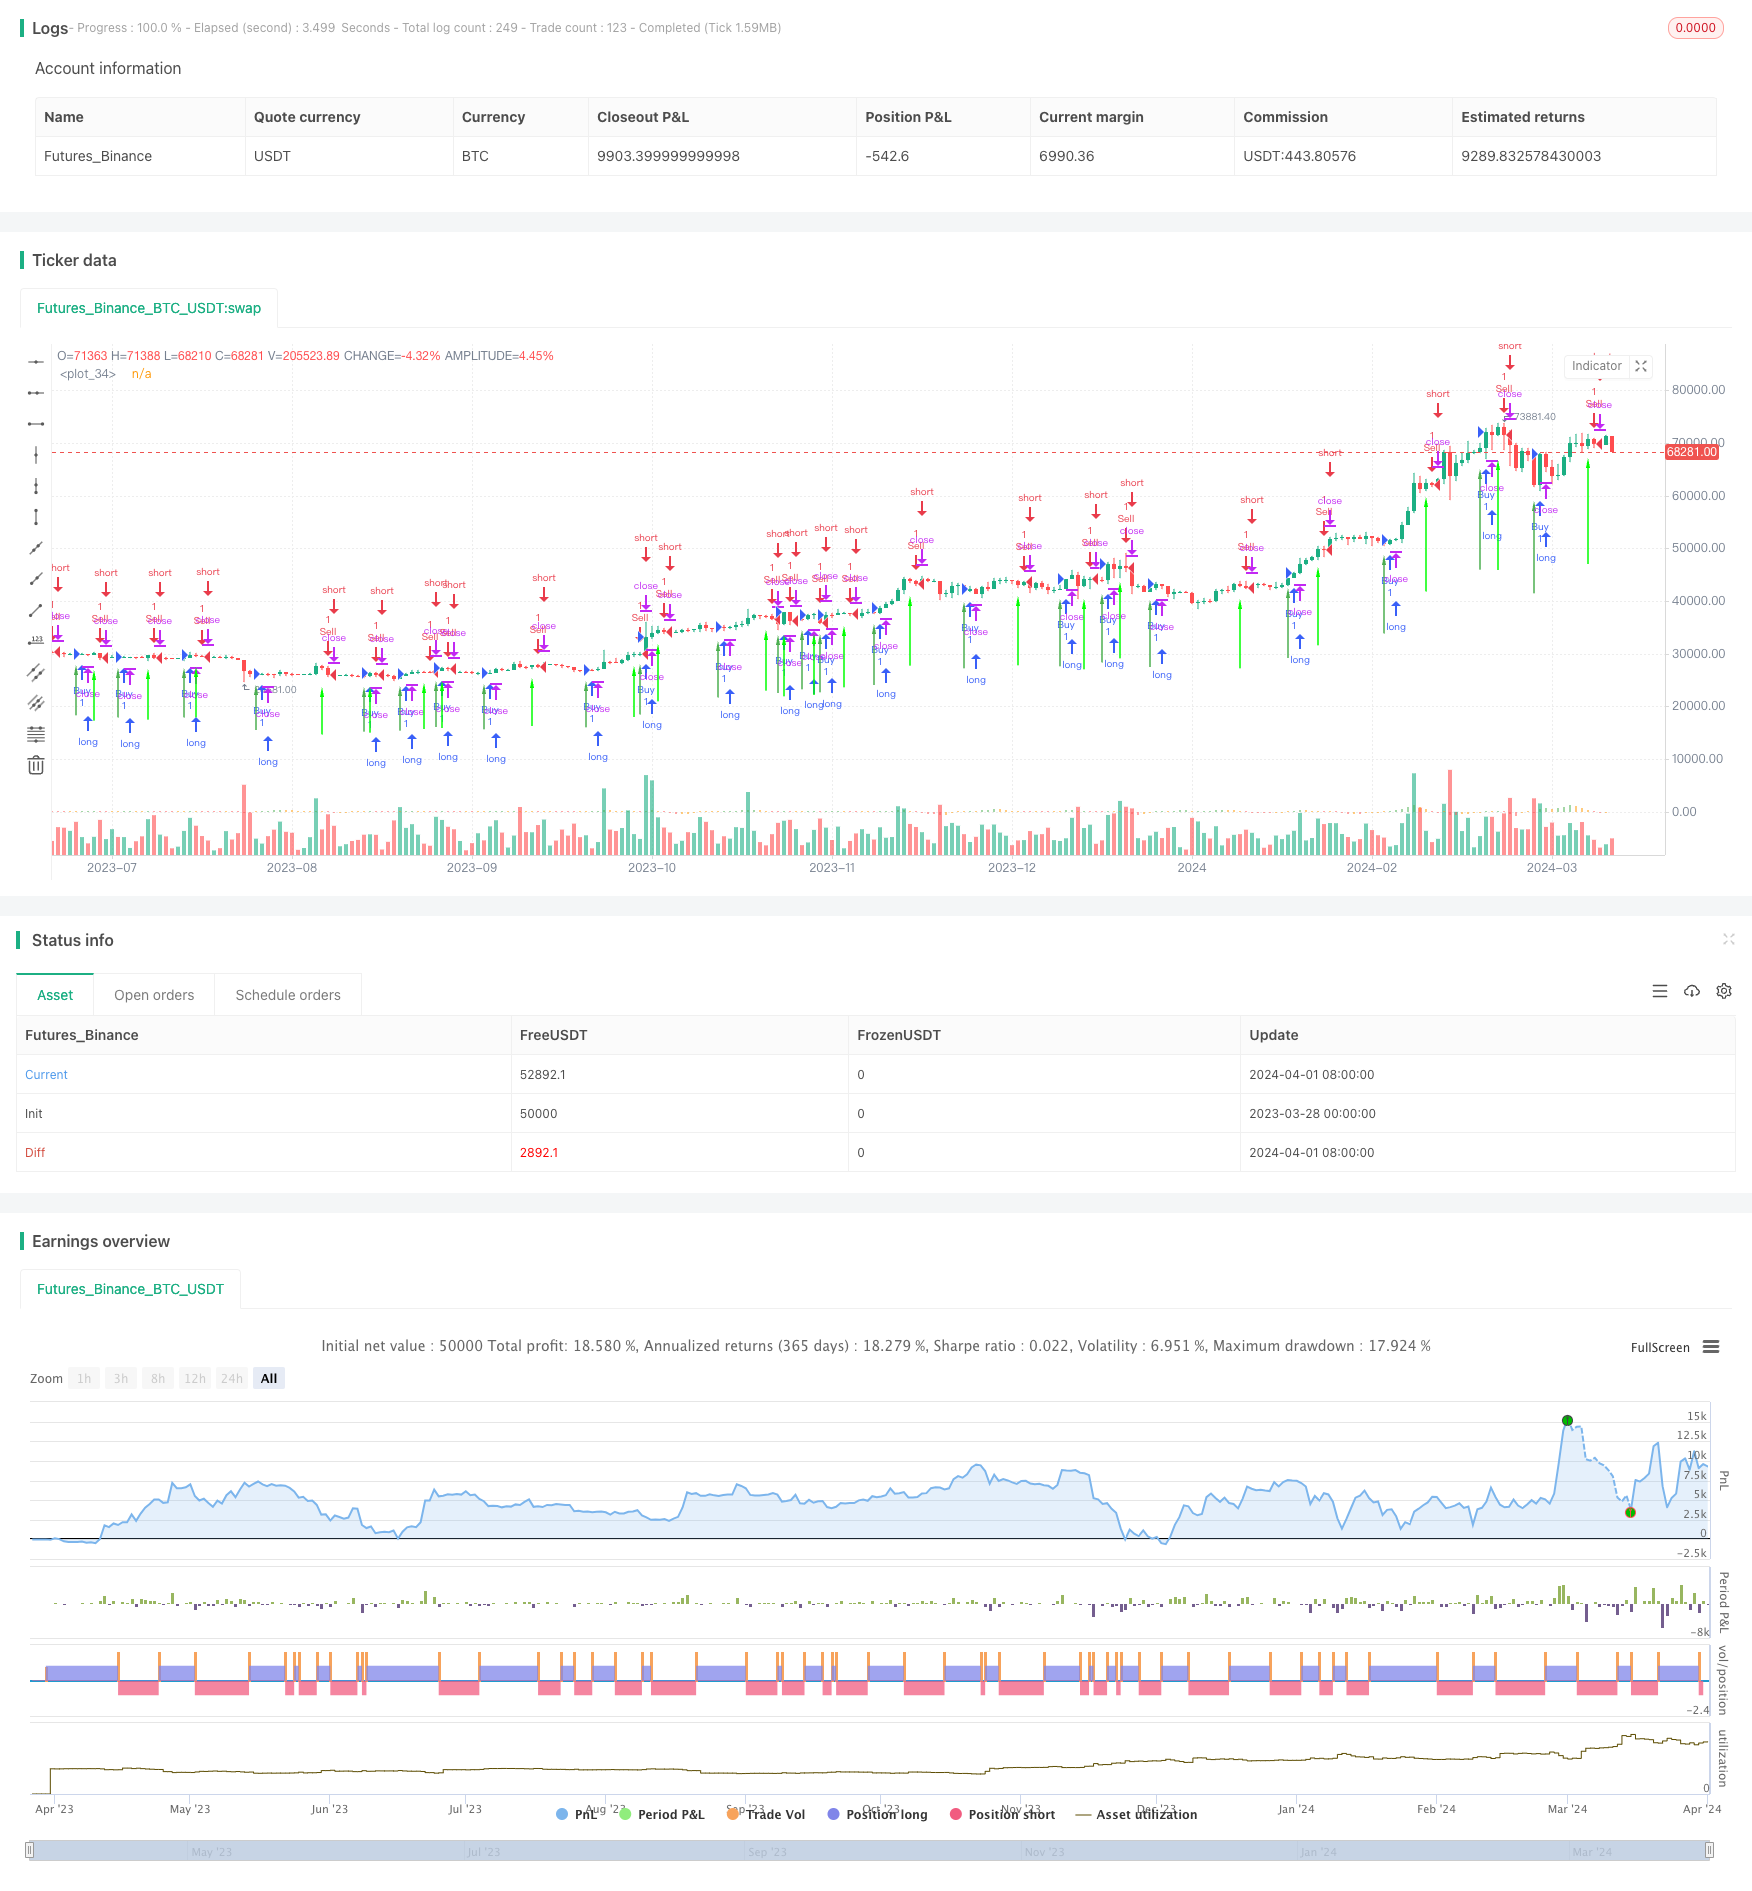
Overview
The MACD TEMA Crossover Strategy is a trading strategy based on the MACD and TEMA indicators, optimized for the BTCUSDT 1-hour timeframe. The strategy generates buy and sell signals by calculating the crossover points between the MACD and TEMA lines. A buy signal is generated when the MACD line crosses above the TEMA line, while a sell signal is generated when the MACD line crosses below the TEMA line. The strategy also uses a histogram to represent the difference between the MACD and TEMA lines, with different colors indicating the trend of the difference, providing more intuitive signals.
Strategy Principle
The principle of the MACD TEMA Crossover Strategy is to use the crossover points between the MACD and TEMA indicators as buy and sell signals. MACD is a momentum indicator that measures the rate of change in price by calculating the difference between two moving averages with different periods. TEMA is a trend-following indicator that smooths price fluctuations and identifies trend direction by calculating a triple exponential moving average. When the MACD line crosses above the TEMA line, it indicates a strengthening upward momentum in price, generating a buy signal. Conversely, when the MACD line crosses below the TEMA line, it indicates a strengthening downward momentum in price, generating a sell signal. The strategy also uses a histogram to represent the difference between the MACD and TEMA lines, with changes in the histogram color providing more intuitive signals.
Strategy Advantages
- Combines two indicators, MACD and TEMA, to more accurately capture market trends and momentum changes.
- Uses a histogram to represent the difference between MACD and TEMA, providing more intuitive signals for traders to make quick decisions.
- Adjustable parameters allow optimization based on different market conditions and trading styles.
- Suitable for highly volatile markets like BTCUSDT, effectively capturing short-term price fluctuations.
Strategy Risks
- Both MACD and TEMA indicators are calculated based on historical data and may generate false signals during market anomalies or extreme volatility.
- The strategy may generate more false signals in choppy markets, leading to frequent trades and high trading costs.
- Improper parameter settings may lead to decreased strategy performance, requiring constant optimization and adjustment.
- The strategy does not consider fundamental market factors, such as major news events, and may be affected by unexpected factors.
Strategy Optimization Directions
- Combine with other technical indicators, such as RSI and BOLL, to improve signal reliability and accuracy.
- Introduce stop-loss and take-profit mechanisms to control risk and protect profits.
- Optimize parameters, such as adjusting the periods of MACD and TEMA, to adapt to different market conditions.
- Consider fundamental market factors, such as major news events, to avoid the impact of unexpected factors.
Summary
The MACD TEMA Crossover Strategy is a trading strategy that combines the MACD and TEMA indicators, optimized for the BTCUSDT 1-hour timeframe. The strategy generates buy and sell signals by calculating the crossover points between the two indicators and uses a histogram to provide more intuitive signals. The strategy’s advantages lie in its ability to capture market trends and momentum changes, making it suitable for highly volatile markets. However, it also has some risks, such as false signals and improper parameter settings. In the future, the strategy can be further optimized by combining other technical indicators, introducing stop-loss and take-profit mechanisms, optimizing parameters, and considering fundamental factors.
/*backtest
start: 2023-03-28 00:00:00
end: 2024-04-02 00:00:00
period: 1d
basePeriod: 1h
exchanges: [{"eid":"Futures_Binance","currency":"BTC_USDT"}]
*/

//@version=4
strategy("MACD TEMA Strategy", shorttitle="MACD TEMA", overlay=true)

// Input variables
slow = input(12, "Short period")
fast = input(26, "Long period")
signal1 = input(9, "Smoothing period")

// Calculate TEMA for short and long periods
ema1 = ema(close, slow)
eema1 = ema(ema1, slow)
eeema1 = ema(eema1, slow)
ma1 = 3 * ema1 - 3 * eema1 + eeema1

ema2 = ema(close, fast)
eema2 = ema(ema2, fast)
eeema2 = ema(eema2, fast)
ma2 = 3 * ema2 - 3 * eema2 + eeema2

// Calculate MACD line
macd = ma1 - ma2

// Calculate Signal line
masignal1 = ema(macd, signal1)
mmasignal1 = ema(masignal1, signal1)
mmmasignal1 = ema(mmasignal1, signal1)
signal = 3 * masignal1 - 3 * mmasignal1 + mmmasignal1

// Calculate histogram
histo = macd - signal

// Plot histogram
histo_color = histo >= 0 ? (histo > histo[1] ? color.green : color.orange) : (histo < histo[1] ? color.red : color.orange)
plot(histo, style=plot.style_histogram, color=histo_color)

// Calculate crossover conditions
macd_crossup = crossover(macd, signal)
macd_crossdown = crossunder(macd, signal)

// Plot arrows for buy and sell signals
plotarrow(macd_crossup ? low : na, colorup=color.green, offset=-1)
plotarrow(macd_crossdown ? high : na, colordown=color.red, offset=-1)

// Strategy conditions
if (macd_crossup)
    strategy.entry("Buy", strategy.long)
if (macd_crossdown)
    strategy.entry("Sell", strategy.short)
- Triple EMA + MACD
- Sentiment Oscillator
- Schaff Trend Cycle
- ZeroLag MACD Long Short Strategy
- AK MACD BB INDICATOR V 1.00
- Moving Average Crossover + MACD Slow Line Momentum Strategy
- K's Reversal Indicator I
- CM MACD Custom Indicator - Multiple Time Frame - V2
- MACD BB Breakout Strategy
- VuManChu Cipher B + Divergences Strategy
- SPARK Dynamic Position Sizing and Dual Indicator Trading Strategy
- Moving Average Crossover + MACD Slow Line Momentum Strategy
- Volume-based Dynamic DCA Strategy
- MACD Valley Detector Strategy
- N Bars Breakout Strategy
- Low-Risk Stable Cryptocurrency High-Frequency Trading Strategy Based on RSI and MACD
- Bollinger Bands Stochastic RSI Extreme Signal Strategy
- RSI Dual-Side Trading Strategy
- KRK ADA 1H Stochastic Slow Strategy with More Entries and AI
- Volume MA-based Adaptive Pyramiding Dynamic Stop Loss and Take Profit Trading Strategy
- RSI and Bollinger Bands Double Strategy
- VWMA-ADX Momentum and Trend-Based Bitcoin Long Strategy
- Multi-Indicator Trend Following Dynamic Risk Management Strategy
- Ruda Momentum Trend Trading Strategy
- Dual Moving Average Crossover Strategy
- Modified Bollinger Bands Strategy
- Dynamic Threshold Price Change Breakout Strategy
- Dual Moving Average Lagging Breakout Strategy
- Momentum Trading with Dual Moving Average Crossover Strategy
- Multi-indicator BTC Trading Strategy