Bollinger Bands Stochastic RSI Extreme Signal Strategy
Author: ChaoZhang, Date: 2024-04-12 16:36:42Tags: RSISTOCHBBBBSR
Overview
This strategy uses Bollinger Bands and Stochastic RSI indicators to generate signals that may indicate price reversals. By default, bearish signals are shown as red arrows and bullish signals as green arrows. Before sending a signal, the strategy looks for the following conditions: (bullish) the candle closes above the upper Bollinger Band, the subsequent candle closes inside the upper band, and the Stochastic RSI is below a preset threshold (default 10); (bearish) the candle closes below the lower Bollinger Band, the subsequent candle closes inside the lower band, and the Stochastic RSI is above a preset threshold (default 90).
Strategy Principle
The core principle of this strategy is to use Bollinger Bands and Stochastic RSI, two technical indicators, to capture potential price reversal signals. Bollinger Bands consist of a middle band (usually a moving average) and two upper and lower bands (middle band plus/minus standard deviations), which can reflect price volatility. When the price breaks through the upper or lower band, it usually indicates that market sentiment is overly optimistic or pessimistic, and the price may reverse. Stochastic RSI is a stochastic indicator applied on top of the RSI indicator, which more sensitively reflects the overbought and oversold state of the market. When the Stochastic RSI reaches extreme areas (such as above 90 or below 10), it also indicates a potential reversal. This strategy combines the conditions of Bollinger Band breakout and Stochastic RSI extremes, which can reliably capture the timing of price reversals.
Strategy Advantages
- Double confirmation: The strategy uses both Bollinger Bands and Stochastic RSI indicators, forming a double confirmation mechanism that can effectively filter out false signals and improve signal reliability.
- Timely reversal capture: Bollinger Band breakouts and Stochastic RSI extremes are important signs of market sentiment reversal. The strategy can capture these key moments in a timely manner and provide timely trading signals to investors.
- Flexible parameters: The parameter settings of the strategy are relatively flexible, such as the period and width of Bollinger Bands, the period and overbought/oversold thresholds of Stochastic RSI, etc., which can be optimized and adjusted according to different markets and varieties.
- Wide applicability: The strategy can be applied to various financial markets and trading products, such as stocks, futures, foreign exchange, cryptocurrencies, etc. By adjusting parameters, it can adapt to different market characteristics.
Strategy Risks
- Poor performance in rangebound markets: In rangebound markets, prices often fluctuate near the upper and lower bands of Bollinger Bands, and the Stochastic RSI frequently enters overbought and oversold zones, which may give more false signals, leading to frequent trades and fund attrition.
- Lag in trending markets: In strong trending markets, prices may break through the upper or lower Bollinger Bands for a long time, and the Stochastic RSI may also remain in overbought or oversold areas for a long time. At this time, the strategy may issue lagging reversal signals and miss trend trading opportunities.
- Sensitive to parameter settings: The performance of the strategy is quite sensitive to parameter settings. Different parameter combinations may bring significantly different results. Parameter settings need to be constantly debugged and optimized according to market conditions, which increases the difficulty of use.
Strategy Optimization Directions
- Add trend confirmation: On the basis of the current strategy, some trend confirmation indicators can be added, such as moving averages, MACD, etc., to identify the current trend direction and strength, avoid counter-trend trading when the trend is clear, and improve the adaptability of the strategy.
- Dynamic parameter adjustment: According to changes in market volatility, dynamically adjust the width of Bollinger Bands and the overbought/oversold thresholds of Stochastic RSI. Use wider bands and higher thresholds when volatility is high to reduce trading frequency; use narrower bands and lower thresholds when volatility is low to improve trading sensitivity.
- Introduce stop-loss and take-profit: After the strategy generates trading signals, corresponding stop-loss and take-profit rules can be set to control the risk exposure and profit target of a single transaction, thereby improving the risk-reward ratio of the strategy.
- Combine with other technical indicators: The strategy can be combined with other technical indicators, such as support and resistance levels, trading volume, etc., to form a more robust signal confirmation mechanism and improve the reliability and profitability of the strategy.
Summary
The Bollinger Bands Stochastic RSI Extreme Signal Strategy combines two technical indicators, Bollinger Bands and Stochastic RSI, using price breakouts of the upper and lower Bollinger Bands and Stochastic RSI reaching overbought/oversold extreme areas as potential reversal signals, forming a simple and easy-to-use trading strategy. The strategy has advantages such as reliable signals and wide applicability, but it performs poorly in rangebound markets, may lag in trending markets, and is quite sensitive to parameter settings. Therefore, in practical applications, we can consider optimizing and improving the strategy from aspects such as trend confirmation, dynamic parameters, stop-loss and take-profit, and combining with other indicators, in order to improve its adaptability and profitability and better serve quantitative trading practice.
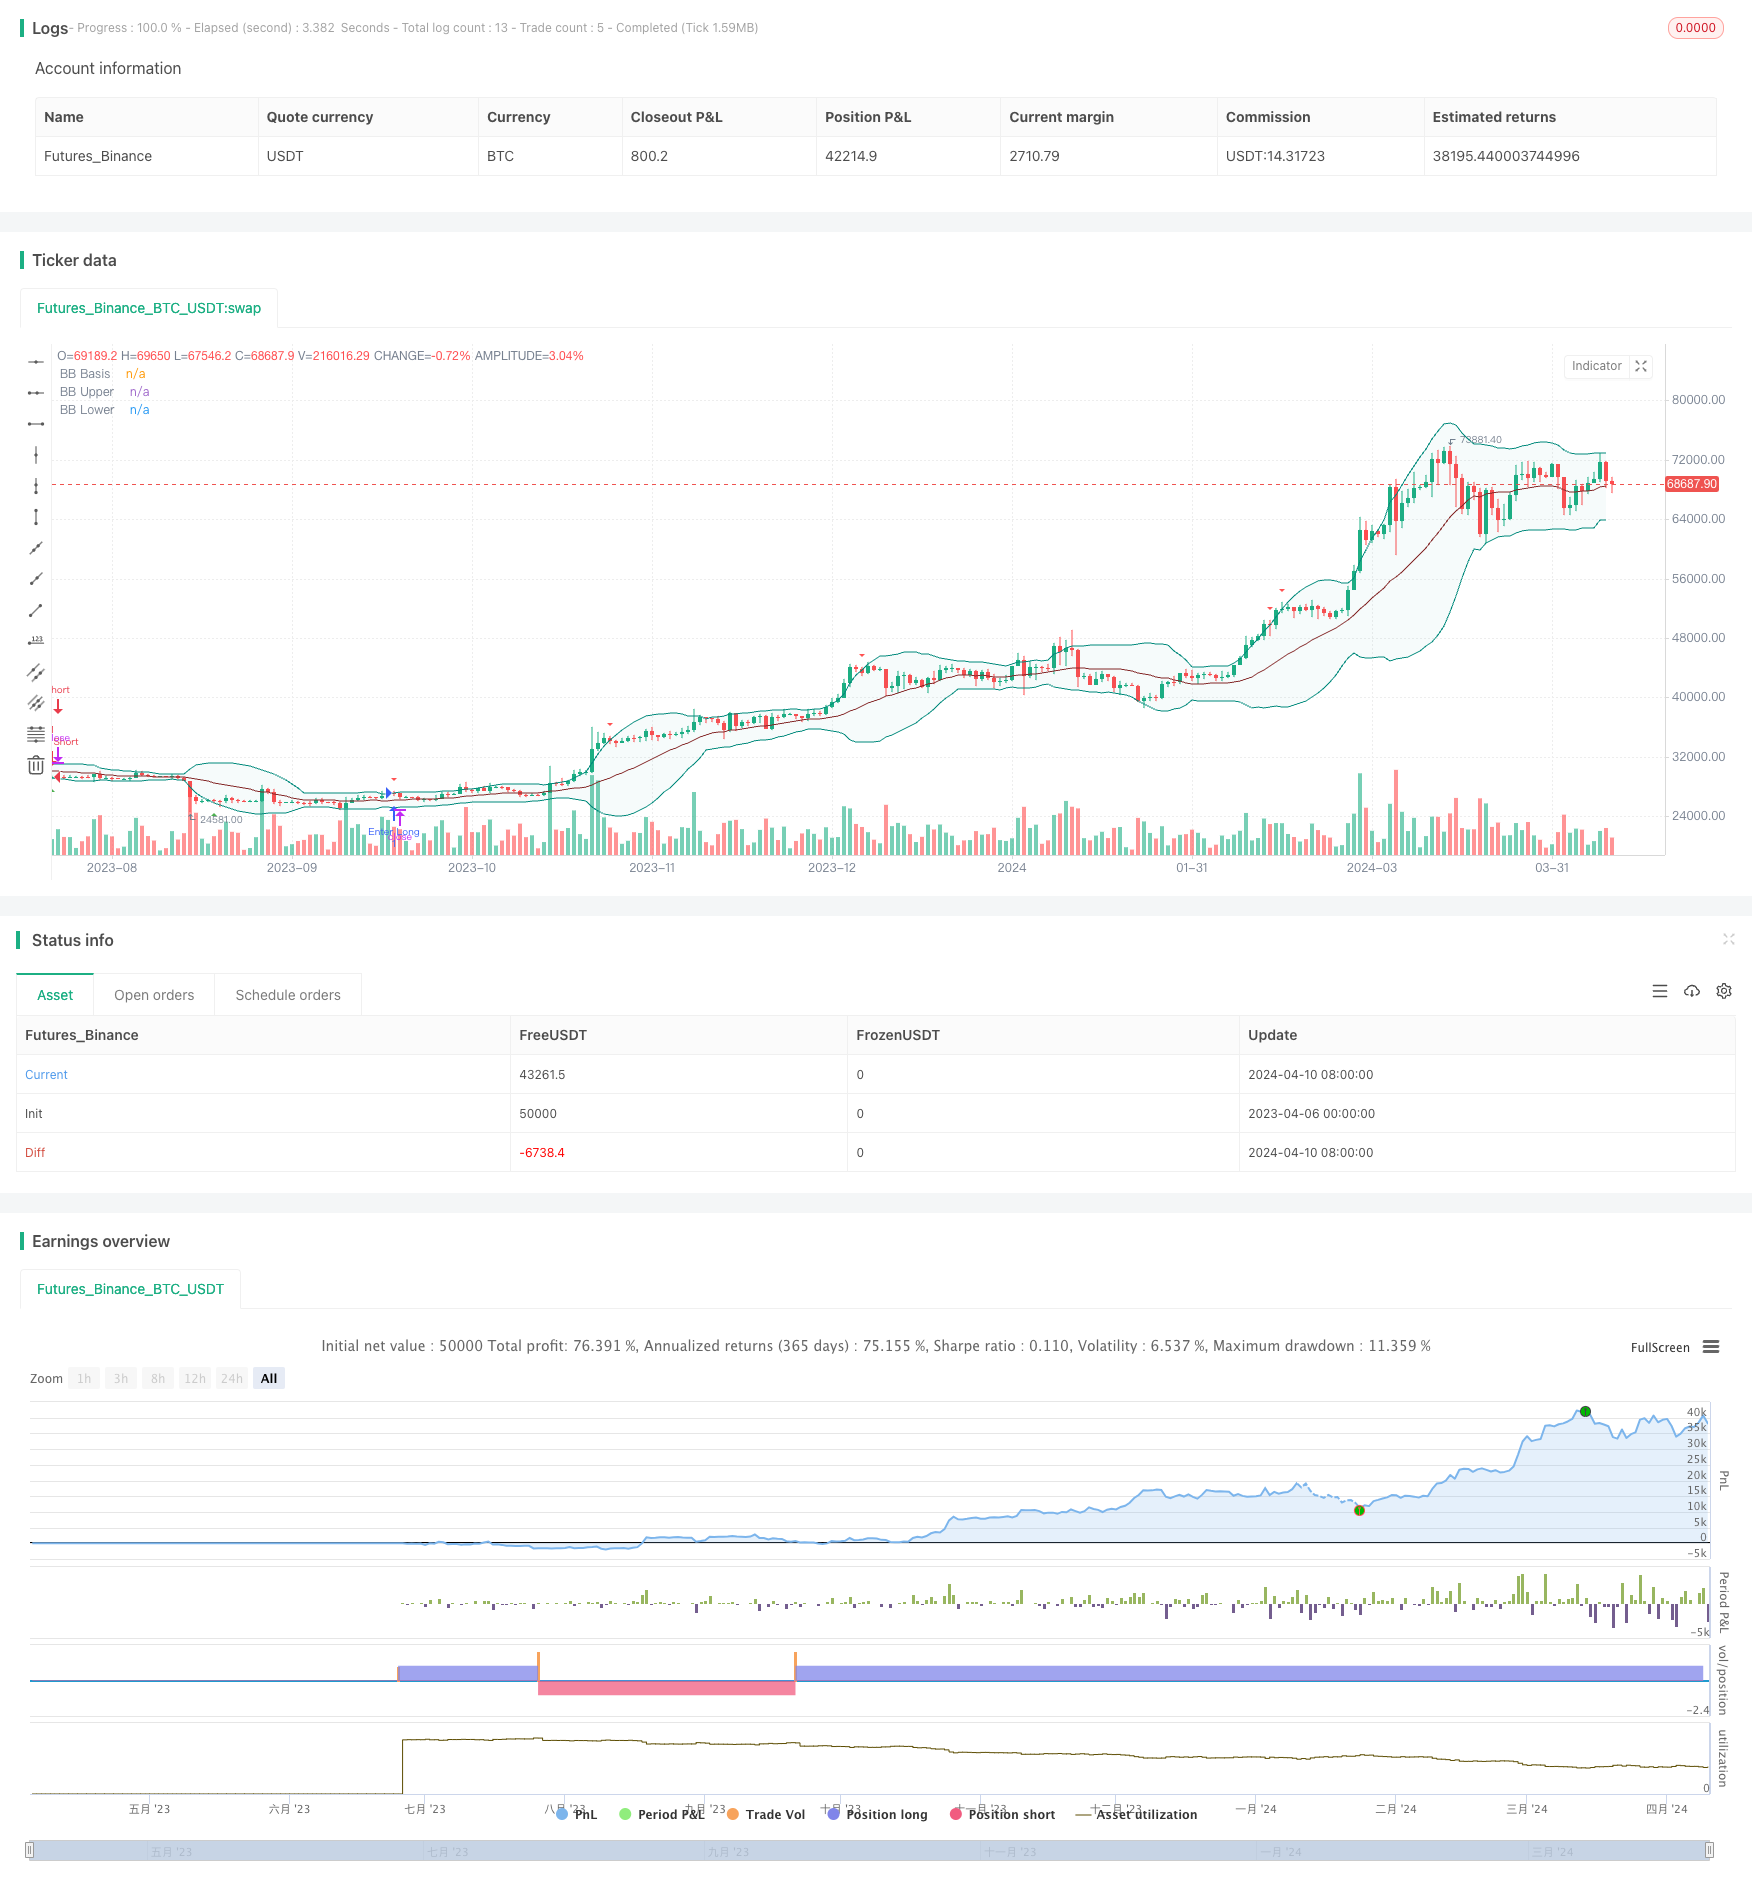
/*backtest
start: 2023-04-06 00:00:00
end: 2024-04-11 00:00:00
period: 1d
basePeriod: 1h
exchanges: [{"eid":"Futures_Binance","currency":"BTC_USDT"}]
*/

//@version=5
strategy(shorttitle='BBSR Extreme', title='Bollinger Bands Stochastic RSI Extreme Signal', overlay=true)

//General Inputs
src = input(close, title='Source')
offset = input.int(0, 'Offset', minval=-500, maxval=500)

//Bollinger Inputs
length = input.int(20, title='Bollinger Band Length', minval=1)
mult = input.float(2.0, minval=0.001, maxval=50, title='StdDev')

//Bollinger Code
basis = ta.sma(src, length)
dev = mult * ta.stdev(src, length)
upper = basis + dev
lower = basis - dev
plot(basis, 'BB Basis', color=color.new(#872323, 0), offset=offset)
p1 = plot(upper, 'BB Upper', color=color.new(color.teal, 0), offset=offset)
p2 = plot(lower, 'BB Lower', color=color.new(color.teal, 0), offset=offset)
fill(p1, p2, title='BB Background', color=color.new(#198787, 95))


//Stoch Inputs
smoothK = input.int(3, 'K', minval=1)
smoothD = input.int(3, 'D', minval=1)
lengthRSI = input.int(14, 'RSI Length', minval=1)
lengthStoch = input.int(14, 'Stochastic Length', minval=1)

upperlimit = input.float(90, 'Upper Limit', minval=0.01)
lowerlimit = input.float(10, 'Upper Limit', minval=0.01)

//Stochastic Code
rsi1 = ta.rsi(src, lengthRSI)
k = ta.sma(ta.stoch(rsi1, rsi1, rsi1, lengthStoch), smoothK)
d = ta.sma(k, smoothD)

//Evaluation
Bear = close[1] > upper[1] and close < upper and k[1] > upperlimit and d[1] > upperlimit
Bull = close[1] < lower[1] and close > lower and k[1] < lowerlimit and d[1] < lowerlimit


//Plots
plotshape(Bear, style=shape.triangledown, location=location.abovebar, color=color.new(color.red, 0), size=size.tiny)
plotshape(Bull, style=shape.triangleup, location=location.belowbar, color=color.new(color.green, 0), size=size.tiny)

// Alert Functionality
alertcondition(Bear or Bull, title='Any Signal', message='{{exchange}}:{{ticker}}' + ' {{interval}}' + ' BB Stochastic Extreme!')
alertcondition(Bear, title='Bearish Signal', message='{{exchange}}:{{ticker}}' + ' {{interval}}' + ' Bearish BB Stochastic Extreme!')
alertcondition(Bull, title='Bullish Signal', message='{{exchange}}:{{ticker}}' + ' {{interval}}' + ' Bullish BB Stochastic Extreme!')


if Bear
    strategy.entry('Enter Long', strategy.long)
else if Bull
    strategy.entry('Enter Short', strategy.short)
- BBSR Extreme Strategy
- Stochastic + RSI, Double Strategy
- RSI and Bollinger Bands Double Strategy
- Buy&Sell Strategy depends on AO+Stoch+RSI+ATR
- RSI - Buy Sell Signals
- RSI统计套利策略
- RSI Relative Strength Index Strategy
- RSI MTF Ob+Os
- TMA-Legacy
- Bollinger + RSI, Double Strategy v1.1
- High-Frequency Reversal Trading Strategy Based on Momentum RSI Indicator
- RSI Relative Strength Index Strategy
- Bollinger Bands Breakout Strategy
- Donchian Channel and Larry Williams Large Trade Index Strategy
- SPARK Dynamic Position Sizing and Dual Indicator Trading Strategy
- Moving Average Crossover + MACD Slow Line Momentum Strategy
- Volume-based Dynamic DCA Strategy
- MACD Valley Detector Strategy
- N Bars Breakout Strategy
- Low-Risk Stable Cryptocurrency High-Frequency Trading Strategy Based on RSI and MACD
- RSI Dual-Side Trading Strategy
- KRK ADA 1H Stochastic Slow Strategy with More Entries and AI
- Volume MA-based Adaptive Pyramiding Dynamic Stop Loss and Take Profit Trading Strategy
- MACD TEMA Crossover Strategy
- RSI and Bollinger Bands Double Strategy
- VWMA-ADX Momentum and Trend-Based Bitcoin Long Strategy
- Multi-Indicator Trend Following Dynamic Risk Management Strategy
- Ruda Momentum Trend Trading Strategy
- Dual Moving Average Crossover Strategy
- Modified Bollinger Bands Strategy