Volume-based Dynamic DCA Strategy
Author: ChaoZhang, Date: 2024-04-12 17:12:07Tags: QFLDCATPSLATRADXEMASMARSIMACD
Overview
This strategy is a volume-based dynamic DCA strategy that uses price breakouts. It identifies the most recent price low and starts building positions when the price breaks below that low and the trading volume increases. As the price continues to fall, the strategy dynamically adjusts the quantity of each position based on the size of the floating loss until it reaches the set total number of positions. At the same time, the strategy sets the take-profit price based on the median of the historical price drop percentages.
Strategy Principles
- Use the ta.pivotlow() function to identify the most recent price low and treat it as a support level.
- Calculate the historical price drop percentages after breaking the support level and take the median as a reference for the safe distance and take-profit percentage.
- Trigger the position-building signal when the price breaks below the support level and the relative trading volume is greater than the set multiple.
- Based on the set total number of positions, divide the total funds into equal proportions. Each time a position is built, dynamically adjust the position size based on the current number of positions, achieving exponential growth in position size.
- During the position-building process, if the floating loss reaches the set threshold, continue to add positions until the total number of positions is reached.
- When the price rises to the take-profit price, close all positions.
Strategy Advantages
- Dynamic position size adjustment: By dynamically adjusting the size of each position based on the floating loss during the price decline, the strategy controls risk while also allowing for greater profits when the price rebounds.
- Parameter setting based on historical data: By calculating the median of the historical price drop percentages after breaking the support level and using it as a reference for the safe distance and take-profit percentage, the strategy parameters are more closely aligned with actual market conditions.
- Limiting the total number of positions: By setting a total number of positions, the strategy controls its overall risk exposure and avoids excessive losses due to over-positioning.
Strategy Risks
- Support level failure risk: If the market experiences extreme conditions and the price continues to fall sharply after breaking the support level, the strategy’s position-adding mechanism may lead to significant losses.
- Parameter setting risk: The strategy’s performance largely depends on the parameter settings. If the parameters are set improperly, it may lead to poor strategy performance.
- Take-profit price setting risk: If the take-profit price is set too high, potential profits may be missed. If it is set too low, positions may be closed too early, missing opportunities to fully capitalize on price rebounds.
Strategy Optimization Directions
- Introduce more indicators: In determining the position-building signal, more technical indicators such as RSI and MACD can be introduced to improve signal accuracy.
- Optimize money management: Based on factors such as market volatility and account risk tolerance, dynamically adjust the proportion of funds for each position to better control risk.
- Adaptive take-profit and stop-loss: Dynamically adjust the take-profit and stop-loss percentages based on changes in market volatility to better adapt to market changes.
Summary
By dynamically adjusting position sizes and setting parameters based on historical data, this strategy aims to control risk while seeking greater profits during price rebounds. However, the strategy’s performance largely depends on parameter settings and market conditions, and risks still exist. By introducing more indicators, optimizing money management, and using adaptive take-profit and stop-loss, the strategy’s performance can be further improved.
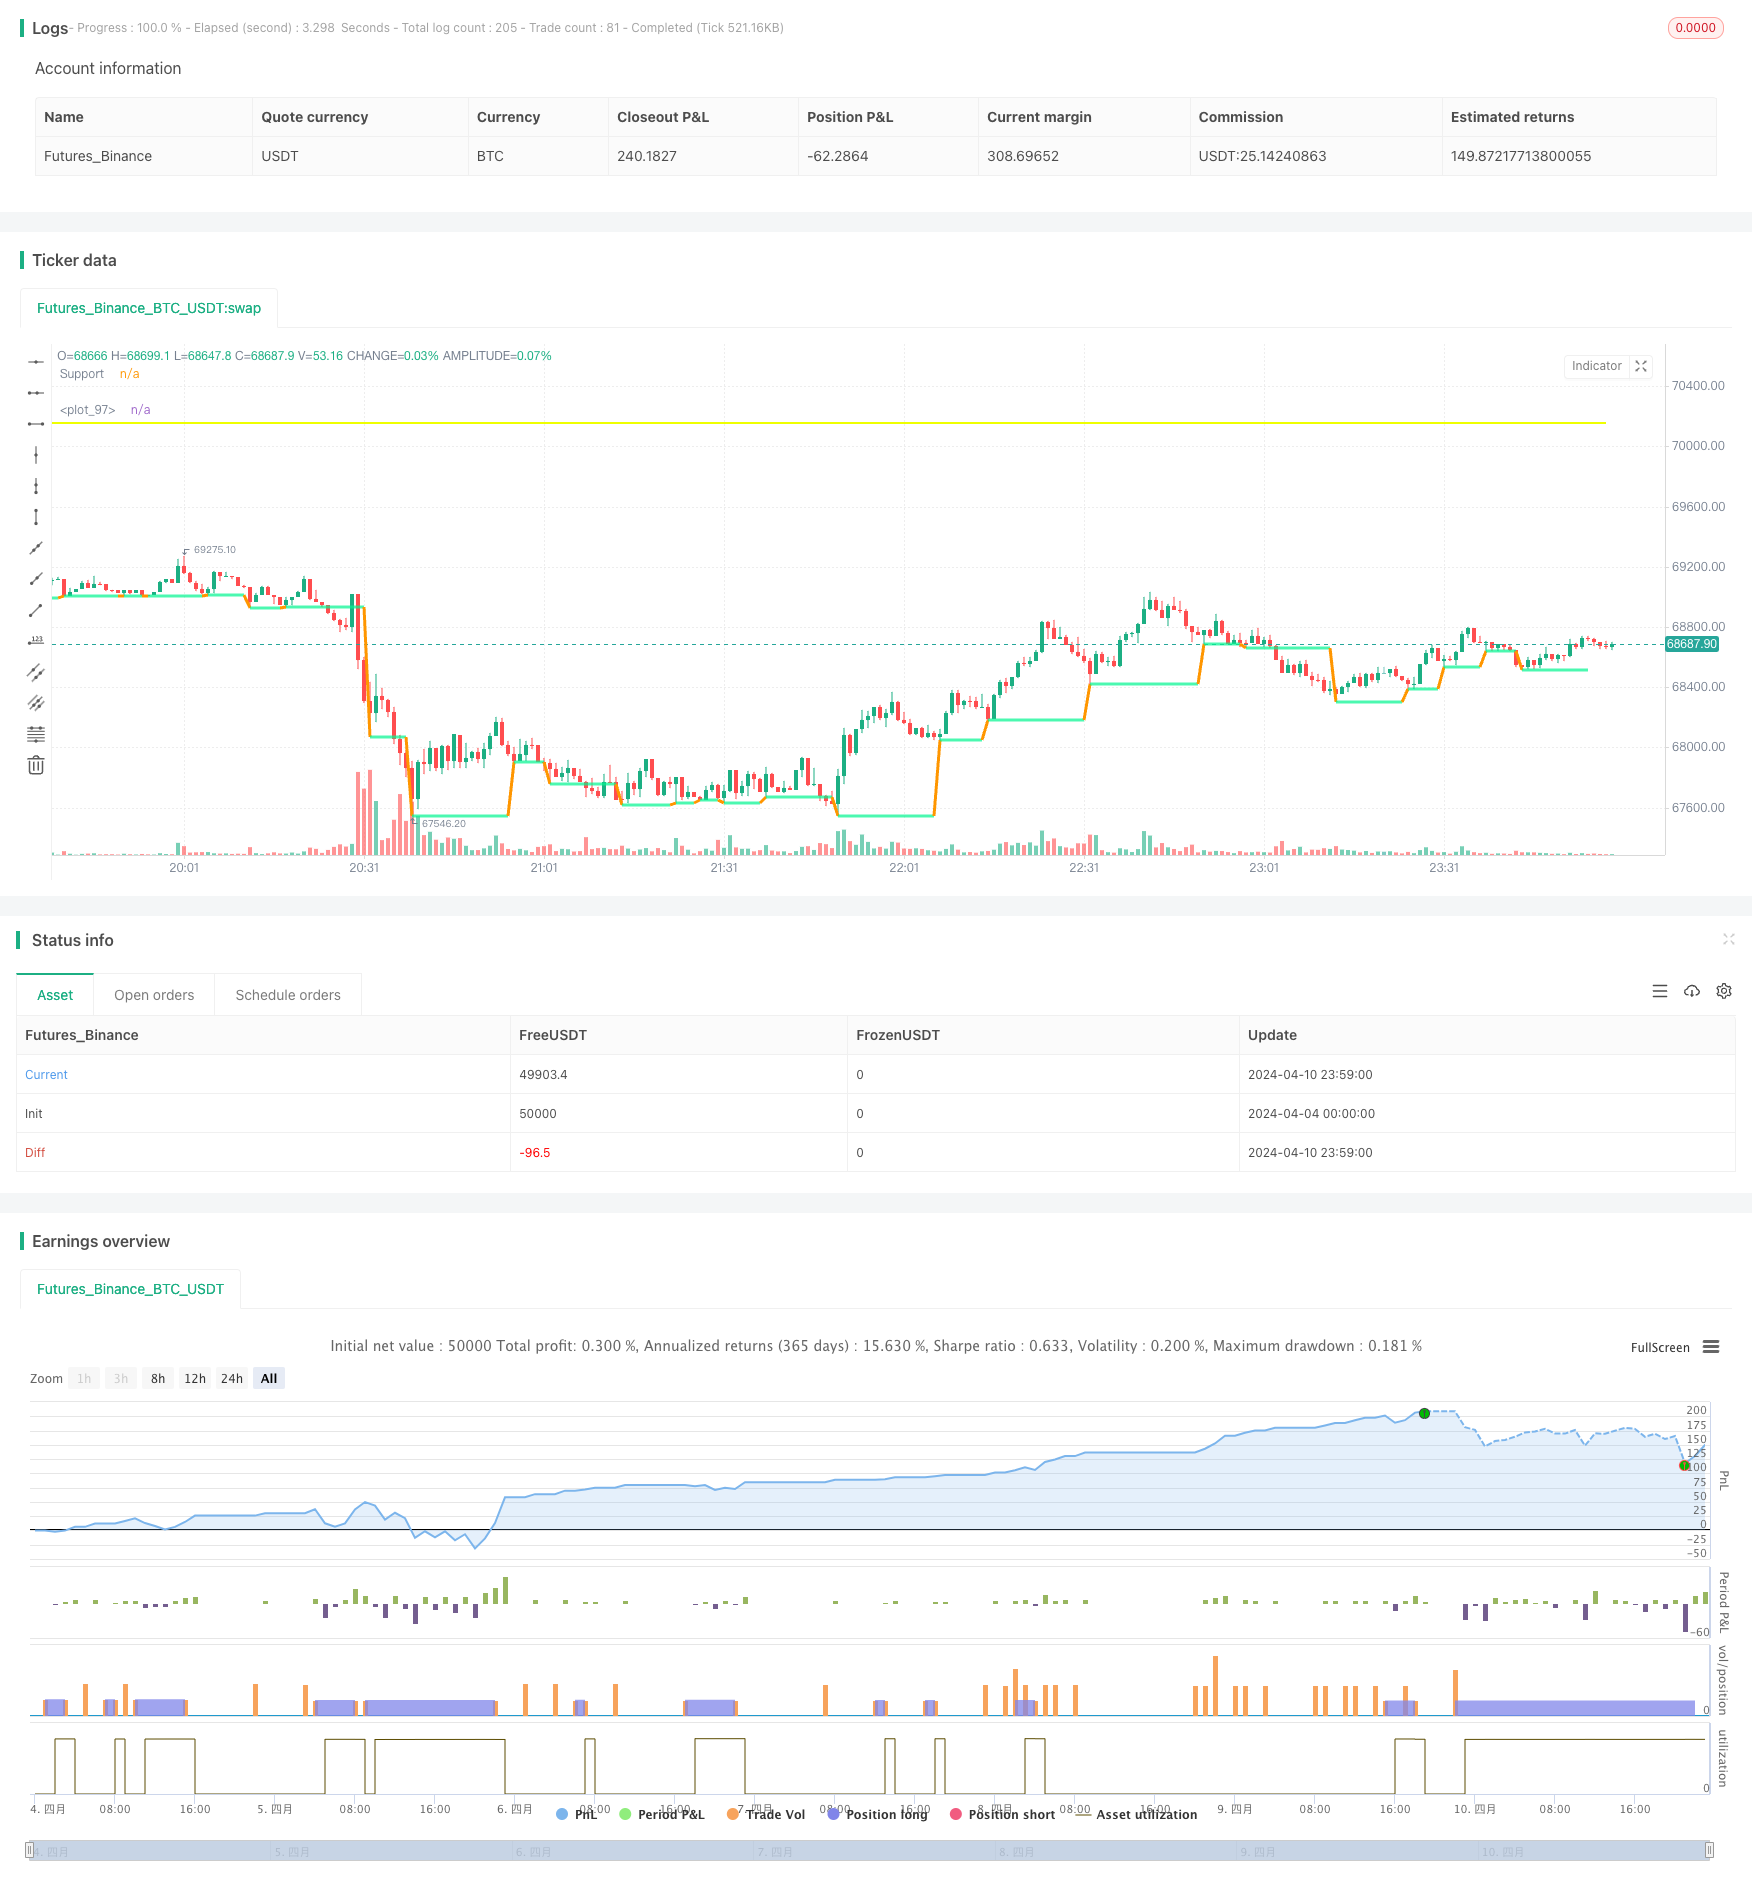
/*backtest
start: 2024-04-04 00:00:00
end: 2024-04-11 00:00:00
period: 1m
basePeriod: 1m
exchanges: [{"eid":"Futures_Binance","currency":"BTC_USDT"}]
*/

// This Pine Script™ code is subject to the terms of the Mozilla Public License 2.0 at https://mozilla.org/MPL/2.0/
// © AHMEDABDELAZIZZIZO

//@version=5

strategy("Qfl Dca strategy", overlay=true)

// Parameters
swing = input(3 , title = "Swing Points")
mediandropmult = input.float(1.1, "Median drop Mult", step=0.1 , tooltip = "The script Calculate The Median Drop for all last Bases That Was cracked you can Increase or decrease it")
floatinglossvalue = input(-5 , "Floating Loss" , tooltip = "Position Floating Loss to start firs DCA order")
num_orders = input(5 , "Number of all orders" , tooltip = " The number of orders is including the base order and the DCA orders the script will alculate every order qty based on the orders number So that the position size doubles with every order")
length = input(20, title="Length of relative volume" ,tooltip =  " the length of relative volume indicator")
mult = input(2.0, title="Volume Multiplier" , tooltip = "you can adjust the relative volume multiplier to find best parameter")
tpmult = input.float(1, step=0.1 ,title = "Take Profit Multiplier" ,tooltip =  " By default, the script is set to take profits based on the same median drop percent you can adjust it as you like")


// Pivot Calculation
p = ta.pivotlow(low, swing, swing)
v = ta.valuewhen(p, low[swing], 0)

// Variables
var float[] lows = array.new_float()
var float chn = na

// Calculate drops
if v < v[1]
    chn := (v[1] - v) / v[1] * 100
    if array.size(lows) < 4000
        array.push(lows, chn)
    else
        array.shift(lows)
        array.push(lows, chn)

mediandrop = array.avg(lows)
maxdrop = array.max(lows)
mindrop = array.min(lows)

// Table display
textcolor = color.white
// tabl = table.new(position=position.top_right, columns=4, rows=4)
// table.cell(table_id=tabl, column=1, row=1, text="Avg Drop %", width=15, text_color=textcolor)
// table.cell(table_id=tabl, column=2, row=1, text="Min Drop %", width=15, text_color=textcolor)
// table.cell(table_id=tabl, column=3, row=1, text="Max Drop %", width=15, text_color=textcolor)
// table.cell(table_id=tabl, column=1, row=2, text=str.tostring(mediandrop), width=10, text_color=textcolor)
// table.cell(table_id=tabl, column=2, row=2, text=str.tostring(mindrop), width=10, text_color=textcolor)
// table.cell(table_id=tabl, column=3, row=2, text=str.tostring(maxdrop), width=10, text_color=textcolor)

// Plot support
t = fixnan(ta.pivotlow(low, swing, swing))
plot(t, color=ta.change(t) ? na : #03f590b6, linewidth=3, offset=-(swing), title="Support")

// Calculate relative volume
avgVolume = ta.sma(volume, length)
relVolume = volume / avgVolume

// Base Activation
var bool baseisactive = na
if not na(p)
    baseisactive := true

// Buy Signal Calculation
buyprice = v * (1 - (mediandrop / 100) * mediandropmult)
signal = close <= buyprice and relVolume > mult and baseisactive

// Take Profit Calculation
tpsl = (mediandrop / 100)
tp = (strategy.position_avg_price * (1 + (tpsl * tpmult)))

// Position Sizing
capital_per_order(num_orders, equity) =>
    equity / math.pow(2, (num_orders - 1))

equity_per_order = capital_per_order(num_orders, strategy.equity)

qty_per_order(equity_per_order, order_number) =>
    equity_per_order * order_number / close

// Calculate floating loss
floatingLoss = ((close - strategy.position_avg_price) / strategy.position_avg_price) * 100

// Strategy Entries
if signal and strategy.opentrades == 0
    strategy.entry("Buy", strategy.long, qty=qty_per_order(equity_per_order, 1))
    baseisactive := false

for i = 1 to num_orders -1
    if signal and strategy.opentrades == i and floatingLoss <= floatinglossvalue
        strategy.entry("Buy", strategy.long, qty=qty_per_order(equity_per_order, i), comment="DCA Order" + str.tostring(i))
        baseisactive := false

// Strategy Exit
strategy.exit("exit", "Buy", limit=tp)

// Plot
plot(strategy.position_avg_price, color=color.rgb(238, 255, 0), style=plot.style_linebr, linewidth=2)
- Elliott Wave Theory 4-9 Impulse Wave Automatic Detection Trading Strategy
- Trend-Following Variable Position Grid Strategy
- Enhanced EMA Crossover Strategy with RSI/MACD/ATR
- Multi-Indicator Trend Following Dynamic Risk Management Strategy
- VuManChu Cipher B + Divergences Strategy
- MACD Valley Detector Strategy
- KRK ADA 1H Stochastic Slow Strategy with More Entries and AI
- Super Scalper - 5 Min 15 Min
- Scalping EMA ADX RSI with Buy/Sell
- ML Alerts Template
- MACD Crossover Strategy
- Optimized MACD Trend-Following Strategy with ATR-based Risk Management
- ZeroLag MACD Long Short Strategy
- BBSR Extreme Strategy
- High-Frequency Reversal Trading Strategy Based on Momentum RSI Indicator
- RSI Relative Strength Index Strategy
- Bollinger Bands Breakout Strategy
- Donchian Channel and Larry Williams Large Trade Index Strategy
- SPARK Dynamic Position Sizing and Dual Indicator Trading Strategy
- Moving Average Crossover + MACD Slow Line Momentum Strategy
- MACD Valley Detector Strategy
- N Bars Breakout Strategy
- Low-Risk Stable Cryptocurrency High-Frequency Trading Strategy Based on RSI and MACD
- Bollinger Bands Stochastic RSI Extreme Signal Strategy
- RSI Dual-Side Trading Strategy
- KRK ADA 1H Stochastic Slow Strategy with More Entries and AI
- Volume MA-based Adaptive Pyramiding Dynamic Stop Loss and Take Profit Trading Strategy
- MACD TEMA Crossover Strategy
- RSI and Bollinger Bands Double Strategy
- VWMA-ADX Momentum and Trend-Based Bitcoin Long Strategy